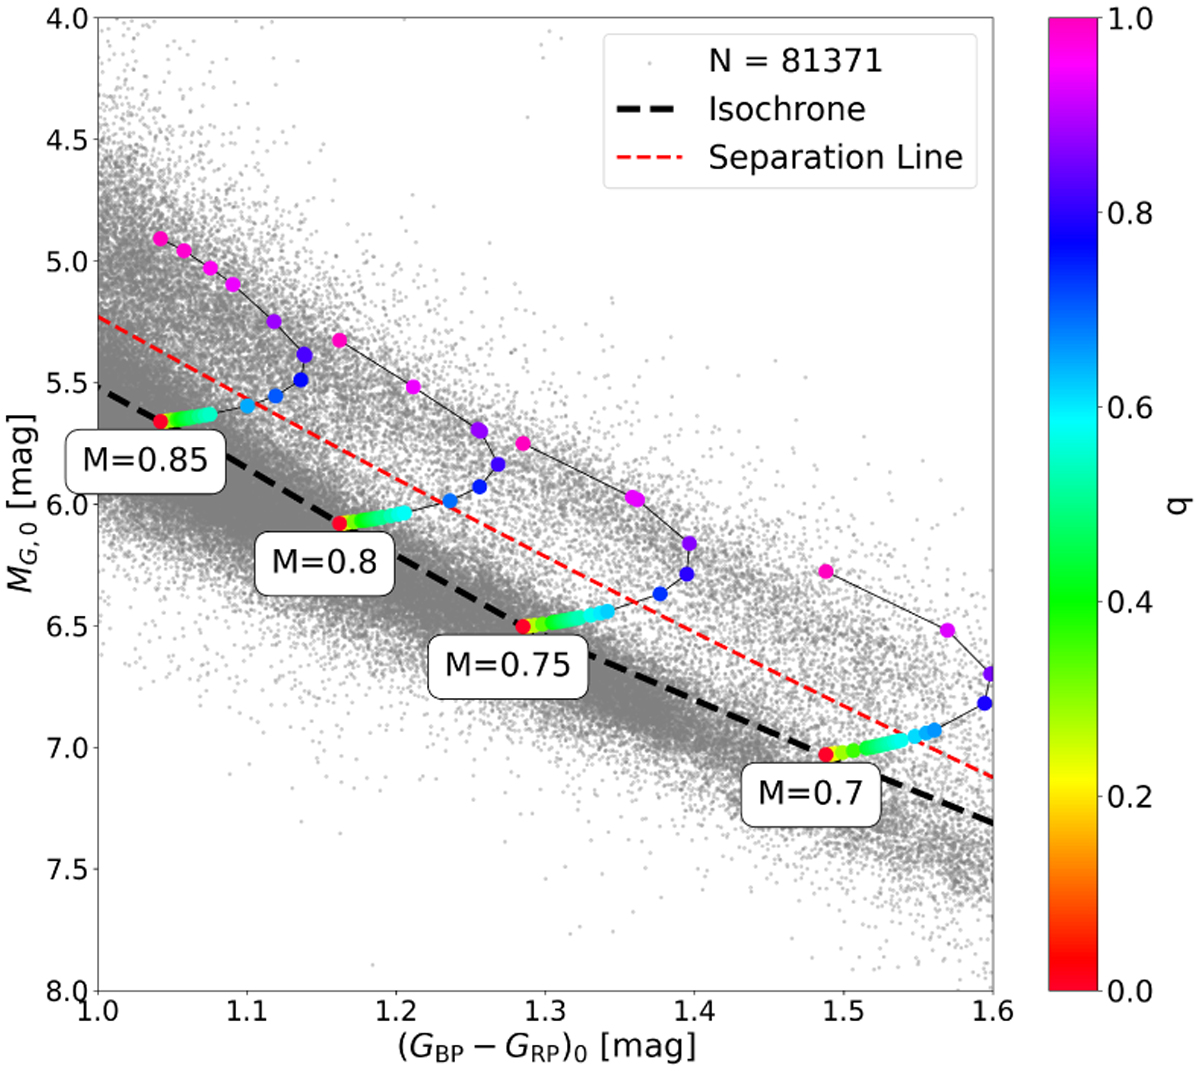
Fig. 2

Download original image
Same as Fig. 1 but over-plotted with isochrones with an age of 4.5 Gyr and metallicity [Fe/H] = 0. Four primary masses (0.7, 0.75, 0.8, 0.85 solar mass) are positioned on the isochrone. For each isochrone, binaries of different mass ratios are simulated and colour-coded by their mass ratio, q. The binaries with q = 1 appear on the upper strip, positioned 0. 752 magnitudes above their lower-strip single primaries. Isochrones are derived from the PARSEC models (see the main text). The red line separates the two strips; the line equation is −0.44 × x2 + 4.3 × x + 1.37. It is generated based purely on the MG,0 histograms, as explained in Section 2.1. For a similar simulation, see Fig. 1 in Wallace (2024).
Current usage metrics show cumulative count of Article Views (full-text article views including HTML views, PDF and ePub downloads, according to the available data) and Abstracts Views on Vision4Press platform.
Data correspond to usage on the plateform after 2015. The current usage metrics is available 48-96 hours after online publication and is updated daily on week days.
Initial download of the metrics may take a while.


