| Issue |
A&A
Volume 693, January 2025
|
|
|---|---|---|
| Article Number | A192 | |
| Number of page(s) | 7 | |
| Section | Interstellar and circumstellar matter | |
| DOI | https://doi.org/10.1051/0004-6361/202452646 | |
| Published online | 17 January 2025 | |
Exploring the non-thermal physics behind the pulsar wind nebula PSR J2030+4415 through radio observations
1
Departament de Física Quàntica i Astrofísica, Institut de Ciències del Cosmos, Universitat de Barcelona, IEEC-UB,
Martí i Franquès 1,
08028
Barcelona,
Spain
2
Instituto Argentino de Radioastronomía, CONICET-CICPBA-UNLP,
CC5(1897) Villa Elisa,
Prov. de Buenos Aires,
Argentina
3
Indian Institute of Space Science and Technology,
Thiruvananthapuram
695 547,
Kerala,
India
4
Departamento de Física (EPSJ), Universidad de Jaén,
Campus Las Lagunillas s/n, A3,
23071
Jaén,
Spain
★ Corresponding authors; This email address is being protected from spambots. You need JavaScript enabled to view it.
; This email address is being protected from spambots. You need JavaScript enabled to view it.
; This email address is being protected from spambots. You need JavaScript enabled to view it.
Received:
17
October
2024
Accepted:
8
December
2024
Abstract
Context. PSR J2030+4415 is a gamma-ray pulsar with an X-ray pulsar wind nebula elongated along the north-south direction. The system shows a prominent X-ray filament oriented at an angle of 130° to the nebula axis.
Aims. To improve our understanding of the non-thermal processes occurring in the pulsar wind nebula, we attempted to determine the possible existence of a radio counterpart, study its morphology, and obtain restrictive upper limits of the pulsar and filament emission at radio wavelengths.
Methods. We performed observations of the pulsar PSR J2030+4415 and its surroundings with the upgraded Giant Metrewave Radio Telescope (uGMRT) at two frequency bands, and put the results in context with findings at other wavelengths.
Results. We obtained radio images at 736 and 1274 MHz that reveal a structure trailing the pulsar, with a morphology overlapping the X-ray nebula. This radio structure is the radio counterpart of the X-ray pulsar wind nebula. The derived spectral index along this structure shows spatial variation. There are no hints of the pulsar and the filament at any of the explored radio frequencies, but we obtained restrictive upper limits. A physical scenario that combines the radio and the X-ray observations, and consistent with IR data, of the nebula and the filament is presented. We propose that particle acceleration occurs in the nebula tail due to the presence of a re-collimation shock, and the highest energy particles gradually escape from it through energy-dependent diffusion. We also find a lower limit in the energy of the particles escaping along the X-ray filament of ~GeV.
Key words: stars: jets / ISM: jets and outflows / pulsars: individual: PSR J2030+4415 / radio continuum: ISM / X-rays: ISM
© The Authors 2025
 Open Access article, published by EDP Sciences, under the terms of the Creative Commons Attribution License (https://creativecommons.org/licenses/by/4.0), which permits unrestricted use, distribution, and reproduction in any medium, provided the original work is properly cited.
This article is published in open access under the Subscribe to Open model. This email address is being protected from spambots. You need JavaScript enabled to view it. to support open access publication.
1 Introduction
PSR J2030+4415 is a radio quiet pulsar discovered in a blind search of Fermi Large Area Telescope (LAT) data (Pletsch et al. 2012). The recently published Third Fermi Large Area Telescope Catalog of Gamma-Ray Pulsars (Smith et al. 2023) lists a total of 294 gamma-ray pulsars that includes PSR J2030+4415, for which they give a pulsar period of P = 227.1 ms, its first derivative Ṗ = 5.05 × 10⁻¹⁵, and a spin-down luminosity of Ė = 1.7 × 1034 erg s−1. The derived characteristic age is τ = P/2Ṗ = 7.13 × 10⁵ yr. The pulsar is moving with a transverse velocity v⊥ = 404 ± 86 dkpc km s−1 and with a position angle PA= 7.2° ± 7.6° (de Vries & Romani 2020). The distance to the pulsar is ~0.5 kpc (de Vries & Romani 2022).
Hɑ images of PSR J2030+4415 show a very bright compact bow shock coincident with the pulsar and a region of extended diffuse emission formed by two bubbles trailing the pulsar (Brownsberger & Romani 2014). A third fainter bubble, surrounding the pulsar, has been discovered by de Vries & Romani (2020).
Observations of PSR J2030+4415 in the X-ray band have revealed a complex system morphology, including an unresolved X-ray source coincident with the pulsar, a trailing pulsar wind nebula (PWN), and a prominent X-ray jet-like structure (Marelli et al. 2015; de Vries & Romani 2020, 2022).
At radio frequencies, PWNe are characterized by typical spectral indices −0.3 ≲ α ≲ 0, where Sν ~ να and Sν is the flux density at frequency ν. In X-rays, the spectra of PWNe are steeper, with photon indices in the range 1 ≲ Γ ≲ 2 and with a median of Γ = 1.7, and Γ ≡ 1 − α (Kargaltsev & Pavlov 2008). PWNe interacting with the surrounding interstellar medium (ISM) can give rise to distinct extended morphological features. Torus-like structures and bipolar jets are observed in pulsars displaying slow proper motions, as well as bow-shaped shocks and extended cometary tails in pulsars moving at high velocities (see e.g. Gaensler & Slane 2006). In the X-ray band, these structures have been resolved in detail in several cases (e.g. Kargaltsev & Pavlov 2008). The shock formed at the termination of the pulsar wind accelerates particles (electrons and positrons) that are advected by the shocked flow in the opposite direction to the pulsar motion. These relativistic particles are responsible for the X-ray PWN powered by PSR J2030+4415 and observed with Chandra, and lower energy electrons and positrons from the same non-thermal particle population are responsible for the radio counterpart.
PSR J2030+4415 belongs to a small subset of supersonically moving PWNs (sPWNs) that exhibit unusually long X-ray jetlike structures. To date, only five secure filaments and three candidates have been identified (Dinsmore & Romani 2024). Some of the most prominent examples of such structures are found in the Guitar Nebula (Hui et al. 2012) and in the Lighthouse Nebula (Pavan et al. 2014), but the number of detection of large-scale filaments from sPWNe is gradually increasing, for example the recent findings in PSR J1135–6055 (Bordas & Zhang 2020) and J1809–1917 (Klingler et al. 2020). In none of these sources has the filament been detected in radio. Very recently, however, Khabibullin et al. (2024) reported the discovery of a faint one-sided radio-emitting filament located ahead of the pulsar PSR J0538+2817, in the direction of the pulsar’s proper motion, with no detected X-ray or optical emission. To explain the first discovered X-ray filament found in the Guitar Nebula, Bandiera (2008) proposed a scenario where the most energetic particles that are accelerated at the pulsar wind termination shock may escape from this region and diffuse into the predominantly ordered magnetic field of the surrounding medium, giving rise to synchrotron X-ray emission.
To determine the possible existence of the radio PWN in PSR J2030+4415 and study its morphology, we performed observations with the upgraded GMRT (uGMRT) and used archival X-ray data from Chandra and infrared data from WISE to place the radio observations in context. We report here the discovery of the radio counterpart of the X-ray PWN associated with this pulsar and a restrictive upper limit for the undetected pulsar and X-ray filament. The WISE infrared images show a lack of emission that matches the PWN morphology. A physical scenario able to explain the available multi-wavelength data is discussed.
2 X-ray data
Chandra and XMM-Newton observations of the γ-ray pulsar PSR J2030+4415 identified its X-ray counterpart at RA(J2000) = 20h 30m 51.4s (±0.15″) and Dec(J2000) = 44°15′38.8″ (±0.16″), with a significance of 15σ, and provided evidence for a ~10″-long PWN elongated along the north-south direction (Marelli et al. 2015). The 0.3–10 keV spectrum of the tail is well described by a power law, with a photon index  , with the unabsorbed X-ray flux of FX,PWN = (4.0 ± 1.6) × 10−14 erg cm−2 s−1 (Marelli et al. 2015). At a distance of 0.5 kpc this gives an X-ray luminosity of LX,PWN = 1.2 × 1030 erg s−1. Later observations by Chandra revealed an unresolved X-ray source coincident with the pulsar, and confirmed the PWN tail, which extended to ~20″, as well as the presence of a one-sided filament extending into the surrounding medium for at least 5′ (de Vries & Romani 2020). The spectral fit of the PWN tail gives ΓX,PWN = 1.48 ± 0.10, a hydrogen column density NH = 0.6 × 1021 cm−2, and a total X-ray flux of ~3 × 1030 erg s−1 using a distance of 0.5 kpc. The fits along the PWN tail showed a softening with distance from the pulsar position, with ΓX,PWN varying from 1.31 to 2.17. This softening may reflect significant synchrotron cooling of the particles during the ~300 years that the pulsar has taken to traverse this structure (de Vries & Romani 2020). As discussed later, this timescale would imply a bulk velocity of the emitting flow similar to that of the pulsar, and much lower than the shocked pulsar wind filling the PWN tail. Deeper Chandra observations showed an extension of the filament of more than 15′(2.2 pc), with a typical filament width of 4″, and oriented at an angle 130° to the PWN axis (de Vries & Romani 2022). These authors made a spectral fit of the filament with an absorbed power-law model (NH = 0.6 × 1021 cm−2) and obtained ΓX,Fil = 1.50 ± 0.12 and a 0.5–7 keV unabsorbed flux per arcmin filament length of
  .
.
We used a Chandra archive image, originally produced by de Vries & Romani (2022) after merging several observations (Obs. Id. 14827, 20298, 22171–22173, 23536, 24954, 24236) obtained from April 2014 to November 2021, to reproduce in Fig. 1 the X-ray field around PSRJ2030+4415.
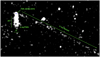 |
Fig. 1 Archive Chandra image of the PSR J2030+4415 field in the 0.5–7 keV energy range. Image adapted from the original produced by de Vries & Romani (2022) after merging several observations (Obs. Id. 14827, 20298, 22171–22173, 23536, 24954, 24236) obtained from April 2014 to November 2021. The blue cross marks the position of PSR J2030+4415. In the image we show only a fraction (160″) of the large-scale filament (15′) (de Vries & Romani 2022). The length and the width of the trailing PWN are 20″ and 9″, respectively. North is up and east to the left. |
3 Previous radio observations towards PSR J2030+4415
We searched for any hint of emission at 1.4 GHz in the NRAO VLA Sky Survey (NVSS), the Very Large Array Sky Survey (VLASS), and the Rapid ASKAP Continuum Survey (RACS) (Condon et al. 1998; Lacy et al. 2020; Duchesne et al. 2023, respectively). A discrete source, centred at the field of view (FoV) centres of the present observations, was detected in the RACS-mid image (1367 MHz, synthesized beam of 40.4″ × 11.2″) with a flux density of 2.9 ± 0.5 mJy. Due to its extension and that of the synthesized beam, it encompasses the location of PSRJ2030+4415 at one of its ends.
At lower frequencies of 325 MHz and 610 MHz, Benaglia et al. (2020, 2021) performed a deep survey of the Cygnus region with the GMRT, including PSR J2030+4415 and its nearby surroundings. We used these data to study in detail the radio emission in the field of PSR J2030+4415. This study reveals a source at 610 MHz of 2.2 ± 0.13 mJy, with a size of about 15″ and located 8″ south of the pulsar position. This radio source partially overlaps the southern extension of the X-ray PWN and is likely the radio counterpart. This source was not detected in the 325 MHz image, giving an upper limit of 1.8 mJy beam−1 at a 3σ confidence level.
4 GMRT observations
We performed observations of the pulsar PSR J2030+4415 and its surroundings with the uGMRT on June 29, 2023, and on June 30 (Project code: 44_014). Specifications of the GMRT systems are given in Swarup et al. (1991) and Gupta et al. (2017).
We observed in two frequency bands, Band 4 (550– 950 MHz, 5 h) and Band 5 (1050–1450 MHz, 4 h), using the GMRT Wideband Backend (GWB) correlator with a bandwidth of 400 MHz (4096 channels). The number of working antennas was 29 in the first run and 30 in the second run. The integration time was 8.053 seconds. The FoV of the GMRT for the different bands is 38±3′ and 23±1′ at Band 4 and Band 5, respectively1. The primary calibrators were 3C286 for Band 4 and 3C48 for Band 5. The source 2052+365 was used as phase calibrator with 5 min scans, bracketing target scans of 35 or 30 min.
The data were processed using the CAPTURE2 continuum imaging pipeline (Kale & Ishwara-Chandra 2021), which is based on tasks from the Common Software Astronomy Applications (CASA, McMullin et al. 2007). The data reduction process included flagging, calibration, imaging, and self-calibration. The flux density calibration was performed using the Perley & Butler (2017) scale. The Multiterm Multi-Frequency Synthesis (MTMFS) algorithm was set in the tclean task to minimize deconvolution errors in broad-band imaging (Rau & Cornwell 2011). Seven rounds of self-calibration were performed, the last one for phase and amplitude. The images were primary beam corrected.
The synthesized beams of the final images at the highest angular resolution were 4.95″ × 3.22″ for Band 4 and 2.01″ × 2.24″ for Band 5. The final bandwidths resulted in 332 MHz at both observation bands, and the centre frequencies were 736 MHz and 1274 MHz. The attained rms values were up to a 0.040 mJy beam−1 (Band 4) and 0.015 mJy beam−1 (Band 5) on average. Although GMRT is capable of measuring polarization, in our case the observations were carried out in the total intensity mode and not in the full polar configuration. Therefore, in the current data, the polarization information is not available.
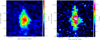 |
Fig. 2 uGMRT radio images of the PSR J2030+4415 field. The white cross in both images marks the position of the pulsar PSR J2030+4415. Left: 736 MHz image, with the synthesized beam shown in the bottom left. Overlaid are the contour levels at 3, 6, 9, and 12 times the rms noise (0.03 mJy beam−1). Right: 1274 MHz image, with the synthesized beam shown in the bottom left. Overlaid are the contour levels at 3, 4, 5, 6, and 7 times the rms noise (0.015 mJy beam−1). |
5 Results
5.1 Extended radio emission: Radio counterpart of the X-ray PWN PSR J2030+4415
The uGMRT radio continuum images are shown in Fig. 2. The 736 MHz image shows an extended structure of about 12″ × 23″, stretching from north to south. This structure would have a physical dimension of 0.030 pc × 0.057 pc, assuming a distance of 0.5 kpc. The brightness of the radio tail increases with the distance from the pulsar, peaking around 18″ (0.045 pc) south of the pulsar (see left panel of Fig. 2). The entire radio structure has a total flux density of 2.99 ± 0.37 mJy within the 3σ contour.
The 1274 MHz image shows a similar morphology, but a bit narrower and slightly more elongated, 9″ × 26″ (i.e. 0.020 pc × 0.063 pc). The peak emission is at the same position as that of 736 MHz (see right panel of Fig. 2). The flux density within the 3σ contour is 3.18 ± 0.41 mJy.
The total intensity radio images at both frequencies reveal a structure trailing the pulsar. The morphology of this radio structure resembles that of PWNe. The positional coincidence between the pulsar position and one extreme of this elongated radio structure suggests a physical connection between them. This is supported by the proper motion of the pulsar, which is northward and opposite to the position of the radio structure. In addition, the radio structure overlaps with the X-ray PWN at both frequencies. Figure 3 illustrates the superposition of X-ray emission and radio emission at the best angular resolution (i.e. Band 5 image), where the CXO image has been smoothed at 1″. Two main features can be appreciated. First, the strongest radio contour corresponds to enhanced X-ray emission, reinforcing the hypothesis of a physical association between the two objects, and second, the radio tail behind the pulsar is more extended than its X-ray counterpart. This larger extension in radio may be due to the relativistic electron synchrotron ageing effect, where low-energy electrons lose energy at a slower rate, resulting in greater longevity that allows them to travel farther from the pulsar. An additional process discussed below that also leads to this effect is the diffusive escape of the most energetic particles, which depletes the nebula tail of X-ray emitting electrons and positrons. We conclude that the radio structure we found is the radio counterpart of the X-ray PWN.
5.2 Radio continuum spectrum of PWN PSR J2030+4415
We proceeded to derive the spectral index distribution map of the extended source found between the two observation bands, centred at 736 and 1274 MHz. For this, we re-imaged the two data sets, by keeping the same uv-range for both, to a common synthesized beam of 6″ × 6″. As before, seven rounds of selfcalibration were required, and the images were primary beam corrected. For the pixel-wise estimation of the spectral index, we corrected for any astrometric differences by carefully aligning the images.
The spectral index and spectral index error maps were created using the Miriad package (Sault et al. 1995). We applied a mask to include only pixels with a signal greater than or equal to 5 rms. In Fig. 4 we show the distribution of α and its error along the PWN. There is spatial variation, with α ranging from −0.60 to 0.80. The spectrum is flat or negative in the central region of the PWN, while it is positive in the northern and southern regions. The weighted mean of the spectral index, where the weighting factor is the inverse square of the error, is −0.041 ± 0.014. The spectral index map shows a kind of band crossing the source from roughly SE to NW with values below −0.1 (down to −0.5), where the spectral index error is mostly smaller than 0.3. In the centre of the source the spectral index α is of the order of −0.2 with an error (eα,centre) of the order of 0.16. If we take into account the pixels where eα is at most 0.4, α reaches 0.3 ± 0.4 for the northern part and 0.5 ± 0.4 for the southern part. There is therefore a spectral index variation between the central and northern regions of |−0.2 − 0.3| = 0.5, which corresponds to 3.1eα,centre, and between the central and southern regions of |−0.2 − 0.5| = 0.7 or 4.4eα,centre. However, these are the most extreme variations; in between, the variation is very smooth, as can be seen in Fig. 4.
Using the radio images with a common synthesized beam of 6″ × 6″, we obtained the radio intensity profiles of PWN PSR J2030+4415 as a function of the distance from the pulsar and compared them with the X-ray profile. The profile scans are shown in Fig. 5. The X-ray peak emission is coincident with the pulsar position and it is at a distance of 17.7″ from the radio peak. These characteristics are qualitatively similar to those found in PSR J1509-5850 (Ng et al. 2010, Kargaltsev et al. 2017).
In order to estimate the synchrotron radio luminosity, we first considered from Fig. 4 the area of the source where the spectral indices were negative. In this 20″ × 10″ area, we obtained a median value of the negative spectral indices of −0.23, with an error ~0.1, and a flux density of 1.38 ± 0.05 mJy at 1274 MHz. Integrating the spectrum from 1 GHz to 100 GHz and taking a radio spectral index of −0.23, we derive a radio luminosity  . Assuming equipartition arguments for synchrotron radio sources (Pacholczyk 1970), no protons, an homogeneous leptonic emitter, and that the magnetic field covers the full volume of the source taken as a cylinder 20″ in height and 5″ in radius, we derive the magnetic field Bradio ~ 93 µG and a minimum total energy Etot ~ 5 × 1041 erg for the radio emitter. Future polarization observations using the uGMRT or ngVLA hold the potential to probe the polarization of the extended radio emission trailing the pulsar motion. These observations could provide valuable insights into the magnetic field geometry within the flow.
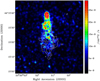 |
Fig. 3 Archive Chandra image of the PWN PSR J2030+4415 convolved to a beam of 1″ × 1″. The overlaid white contours represent the 1274 MHz radio emission from GMRT. The contour levels are 3, 4, 5, 6, and 7 times the rms noise (0.015 mJy beam−1). The white cross marks the position of the pulsar PSR J2030+4415. |
5.3 Upper limits for the pulsar and filament
There are no hints of the pulsar and the filament at any of the explored radio frequencies. For the pulsar we obtained a restrictive 3σ upper limit of 96 µJy beam−1 at 736 MHz and of 90 µJy beam−1 at 1274 MHz for its radio counterpart. Assuming a typical spectral index of −1.60 for the power-law spectra of radio pulsars (Jankowski et al. 2018), we converted the 3σ upper limit of 96 µJy beam−1 at 736 MHz to 1400 MHz, obtaining a value of 34 µJy beam−1 . Radio-quiet pulsars are defined as those that have not been detected in radio down to a flux density limit of 30 µJy at 1400 MHz (Marelli et al. 2015). Therefore, the nondetection of the pulsar in radio provides strong indications of PSR J2030+4415 belonging to the radio-quiet class of gammaray pulsars. For the X-ray filament we can see that the rms noise in the area of 5′ × 30″ covering the first one-third of the filament from the position of the pulsar is 37 µJy beam−1 at 736 MHz (beam: 4.95″ × 3.22″) and 14 µJy beam−1 at 1274 MHz (beam: 2.01″ × 2.24″), which means a 3σ upper limit of 111 µJy beam−1 and 42 µJy beam−1, respectively.
6 An apparent near-infrared signature of the PWN
For completeness, we explored the environments of PSR J2030+4415 using the images of the Wide-field Infrared Survey Explorer (WISE) in the mid-infrared domain (Wright et al. 2010). It is remarkable that the 12 µm W3 band view of the region shows a lack of emission that matches accurately the PWN morphology. This can be seen in the left panel of Fig. 6, where the yellow contour outlines the edges of the radio emission from the GMRT 736 MHz map. The contrast has been strengthened in order to highlight the apparent emission drop. In addition, the right panel of Fig. 6 shows an east–west cut where the emission minimum clearly coincides with the central axis of the PWN. A simple parabolic profile was fitted, excluding the points overlapping with the GMRT contours, to quantify the significance of the emission drop (about ten counts). Given that the rms in this WISE image amounts to about two counts per pixel, as measured in emission free regions, we are dealing with a likely real ~5σ effect. The WISE longer wavelength W4 band lacks enough angular resolution to distinguish this coincidence, while the shorter wavelength bands W1 and W2 are mostly dominated by the stellar content. It is known that the W3 band begins to have a significant sensitivity to thermal emission from interstellar dust. Therefore, the deficit of its extended emission displayed in Fig. 6 could be tentatively interpreted as interstellar dust having been swept away by the PWN along its path. If this suggestion is correct, it could open a new aspect of study dealing with the interplay between pulsar winds and the cold interstellar medium. While examples of optical and infrared emission from bow shocks believed to be associated with fast moving pulsars exist in the literature (Gaensler & Slane 2006; Wang et al. 2013), to our knowledge no previous example of a dark patch seen against a PWN has been described.
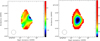 |
Fig. 4 Distribution of the spectral index and its error along the PWN. Left: spectral index image of the PWN PSR J2030+4415 using the Band 4 and Band 5 data. The common synthesized beam of 6″ × 6″ is shown in the bottom left. Right: spectral index error distribution of the PWN PSR J2030+4415 using the Band 4 and Band 5 data. The common synthesized beam of 6″ × 6″ is shown in the bottom left. |
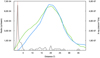 |
Fig. 5 X-ray and radio intensity profiles of PWN PSR J2030+4415 as a function of the distance from PSR J2030+4415. The cutting line that defines the profile scans crosses the pulsar position and follows the proper motion direction of the pulsar (PA= 7.2°). The grey line corresponds to 0.5–7 keV X-ray data, whereas the blue line corresponds to the radio data at 736 MHz and the green line to the 1274 MHz data, with the common synthesized beam of 6″ × 6″. The vertical red dashed line marks the pulsar position. We note that the small X-ray peaks far from the pulsar also represent significant emission. |
7 Theoretical interpretation
The combination of the radio and the X-ray observations of the nebula and the filament associated with PSR J2030+4415 suggests a physical scenario that can be described as follows:
(i) Electrons and positrons are mostly accelerated in the region where the pulsar wind terminates, although further shocks can occur downstream of the shocked pulsar wind. Most of the acceleration is expected to take place where the dissipation of the unshocked wind energy is the strongest, around the bow-shaped region. There, particles can reach energies of E = ηaccqBbowRbow ≈ 220 ηacc TeV, where  cm and
  µG are the size and the magnetic field of the pulsar termination shock region, respectively (taking a medium density of 1 cm−3 and vPSR = 3 × 107 cm s−1, assuming 45° between the pulsar motion and the line of sight), and ηacc is the acceleration efficiency and ηΒ the ratio of magnetic to plasma energy density in the shocked pulsar wind, both being ≲ 1.
(ii) Most of the shocked pulsar wind is advected along the tail of the PWN propagating at a significant fraction of c (unless strong mixing with the ISM takes place; see below). Radio synchrotron emission can be produced by the less energetic particles that follow a hard energy distribution (e.g. Bykov et al. 2017), which explains the hard radio emission of some regions of the PWN. Given the energetics of the forward shock, ≲vPSR Ė/c ≈ 3 × 1031 erg s−1, and its high temperature,  eV for vPSR = 3 × 107 cm s−1, thermal radio emission from the shocked ISM seems insufficient to explain the detected radio fluxes.
(iii) The softer radio emission found at ~20″ from the pulsar may be attributed to a Mach disk (re-collimation) shock produced by the medium thermal pressure, which should form roughly at that distance for typical ISM values: rMach ≈ (Ė/4πcPISM)1/2 ≈ 2″ at 0.5 kpc (where the thermal pressure of the ISM, PISM ~ 1 eV cm−3, was adopted; e.g. Barkov et al. 2019a). In this complex region, particle acceleration may differ from that at the pulsar wind termination, and non-thermal particle energy may be redistributed towards lower energies, which explains the steeper radio spectrum. Entrainment of shocked ISM may also favour this redistribution by reducing the averaged particle energy.
(iv) The X-ray emission from the tail, of likely synchrotron origin, comes from a softer region of the particle spectrum than the radio emission (e.g. Bykov et al. 2017). The observed steepening with distance from the pulsar, with a softening of the X-ray emission along the PWN of ΔΓX = 0.8 ± 0.3 has been interpreted (de Vries & Romani 2020) as a consequence of synchrotron cooling of the electrons and positrons emitting those photons, for example with energies of ~30 TeV for a shocked PWN magnetic field BPWN ~ 30 µG. This cooling takes place on a timescale of a few hundred years, whereas the shocked wind should be leaving the region on a timescale of a few years unless strongly slowed down from mildly relativistic velocities down to hundreds of km s−1, which may occur if strong mixing with the ISM takes place (e.g. due to pinching or Kelvin-Helmholtz instabilities; Barkov et al. 2019b; de Vries & Romani 2020). However, energy-dependent diffusive escape into the ISM by the emitting particles is much faster than synchrotron cooling, and thus may be the actual mechanism behind the observed X-ray steepening as these particles should diffuse out of the region on a timescale of a few years. Taking into account that the slowest diffusion corresponds to the Bohm regime, the diffusion length of particles producing ~1 keV synchrotron photons is  , comparable to the width of the structure, so on those scales the particle speed would be close to c. The lack of detection of X- rays from the escaped particles outside the nebula tail could be a consequence of a significantly weaker ISM magnetic field, which implies a much lower synchrotron emissivity and larger diffusion length, both yielding a low surface brightness.
(v) The obtained mean radio spectral index of the PWN is αR,median = −0.041 ± 0.014. The X-ray emission is also described by a power law, with a photon index Γ ≡ 1 − αX = 1.48 ± 0.10. The extrapolation of the radio power law to X-ray frequencies clearly shows that the X-ray emission is several orders of magnitude lower. Because of this, it can be inferred that the energy particle distribution should follow a broken power law, harder at lower energies. This feature of the energy distribution is not related to the diffusive escape of the particles, which only affects the highest energy end of the distribution.
(vi) Predictions in gamma rays can be done assuming that the highest energy electrons and positrons escaped from the nebula interact via inverse-Compton (IC) scattering with ambient IR/optical photons. Adopting a typical IC target energy densities of 1 eV cm−3, an emitting region size of ~10′, Bohm diffusion, and a power in particles of ~0.1 Ė, the IC flux may reach ~10−13 erg s−1 cm−2. We note however that this is an optimistic prediction as particles may diffuse out of the region much faster.
(vii) As the pulsar moves, ordered ISM magnetic lines are entrained and dragged by the shocked ISM, subsequently becoming amplified with respect to the surrounding ISM magnetic field, due to the interaction. The most energetic particles accelerated in the pulsar wind termination region can reach these ordered magnetic lines and escape into the ISM, where they form filamentary structures that shine in X-rays via synchrotron emission (e.g. Barkov et al. 2019b; Olmi et al. 2024). Adopting a reference value of ~ 10 µG for the filament magnetic field, 1 keV photons are produced by  TeV particles, with an associated radiative time of
  kyr. Given that the magnetic field seems to be mostly ordered and the X-ray filament is narrow, particles are likely to cross the 15′ (2.2 pc) filament at almost the speed of light, which yields a crossing of time tcross ~ 7 yr. Given the observed filament X-ray luminosity of LFil,X ≈ 3.6 × 1030 erg s−1 and the involved timescales, the minimum injected particle luminosity should be ~(tsync/tcross)LFil,X ~ 1.5 × 1033 erg s−1, which is ~10% of the Ė. We note that the ~4″ width of the filament is compatible with the ~10″ scale of the particle gyroradii.
The large-scale X-ray filament, thought to be of synchrotron origin, may have a radio counterpart that has not yet been detected. Our GMRT observations allow us to derive a lower limit on the energy of the particles escaping the bow-shaped region around the pulsar, for which we followed Bordas et al. (2021). First, we computed the expected synchrotron radio luminosity for particles being injected at the base of the filament. For that, we assumed a total jet injection power of Linj = 1.5 × 1033 erg s−1 . Particles are injected following a power-law distribution with exponential index of 2.2, featuring a cut-off at its low- and high-energy ends. For the low-energy cut-off, we considered values ranging from  to 105, whereas we fixed the high-energy to
  . We scanned different values of the filament magnetic field BFil = 10–100 µG, which are higher than those typically found in the ISM as they may be generated by an amplification produced by the relativistic particles themselves (see e.g. Olmi et al. 2024). The radio synchrotron fluxes of the filament were then computed and compared to the upper limits obtained with GMRT Band 4 and Band 5, accounting for the instrument beam at each band, with the additional constraint to provide a luminosity in the X-ray band at the level of the observed luminosity, LX ~ 4 × 1030 erg s−1 (de Vries & Romani 2020). The most conservative lower limit for
  found in the BFil value range explored is of a few times 103; below that value our GMRT observations should have detected the radio emission.
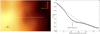 |
Fig. 6 Environment of PSR J2030+4415 using WISE data in the mid-infrared domain. Left: PSR J2030+4415 region as seen in the 12 µm W3 band of WISE. The thin yellow line represents the 2σ contour of the GMRT 736 MHz radio emission, which matches very closely a minimum of the thermal infrared emission. The yellow compass symbol and the horizontal bar indicate the image orientation and angular scale, respectively. Right: East–west emission profile along the white dashed line of the left panel with an attempt to fit the background emission. There is a central drop in counts with respect to the dashed line, in coincidence with the PWN central axis. |
8 Summary and conclusions
We have reported on the discovery of the likely radio counterpart of the PWN associated with PSR J2030+4415 using GMRT dedicated observations of the source at 736 MHz and 1274 MHz frequencies. The extended radio emission is trailing the pulsar motion, with the radio peak found at 0.045 pc from the pulsar location (assuming a distance to the source of 0.5 pc). In X-rays the emission peaks at the pulsar position, and its extension is shorter than in radio. Both radio and X-ray emission might be produced by the same particle population, although the former requires a harder injection index, implying a softening break in the parent particle spectrum. This softening could be interpreted as radiative cooling in the PWN due to synchrotron losses. However, this would require that the flow and the ultrarelativis- tic particles behind the X-rays remain within the PWN region for much longer times than the flow advection time. Alternatively, the observed X-ray softening would be due to high-energy particles escaping the PWN region through energy-dependent diffusion. Such a scenario has been used to successfully explain a number of large-scale features from bow-shock PWNe (see e.g. Bandiera 2008). In the case of PSR J2030+4415, the source indeed displays an X-ray jet-like structure extending unbent for a few parsecs into the surrounding ISM. Our GMRT observations did not reveal a radio counterpart of this jet-like structure, which places a constraint on the cut-off energy for particles being able to escape the PWN at a  of a few ×103. Additionally, we report observations of the source using images of WISE in the mid-infrared band. The emission displays a cavity which spatially coincides with the PWN location. This suggests a novel method to study the interaction of the PWN and the dust present in the surrounding medium.
Acknowledgements
We thank the anonymous referee for useful suggestions and comments that helped to improve the content of the manuscript. We thank the staff of the GMRT that made these observations possible. GMRT is run by the National Centre for Radio Astrophysics of the Tata Institute of Fundamental Research. The authors would like to thank Dr. D.B. Palakkatharappil for providing a code for automatic alignment of GMRT images. We (J.M.P., V.B.-R., P.B.) acknowledge financial support from the State Agency for Research of the Spanish Ministry of Science and Innovation under grants PID2022-136828NB-C41/AEI/10.13039/501100011033/ERDF/EU, PID2022-138172NBC43/AEI/10.13039/501100011033/ERDF/EU and through the Unit of Excellence María de Maeztu 2020–2023 award to the Institute of Cosmos Sciences (CEX2019-000918-M). We acknowledge financial support from Departament de Recerca i Universitats of Generalitat de Catalunya through grant 2021SGR00679. JM acknowledges support from Junta de Andalucía under Plan Complementario de I+D+I (Ref. AST22_00001), Plan Andaluz de Investigación, Desarrollo e Innovación as research group FQM-322, Spanish Ministerio de Ciencia e Innovación, Agencia Estatal de Investigacón (Ref. PID2022-136828NB-C42) and FEDER funds. Part of the scientific results reported in this article are based on observations made by the Chandra X-ray Observatory and published previously in cited articles [Chandra ObsId 14827, 20298, 22171–22173, 23536, 24954, 24236]. This research has made use of NASA’s Astrophysics Data System. This research has made use of the SIM- BAD database, operated at CDS, Strasbourg, France. This publication makes use of data products from the Wide-field Infrared Survey Explorer, which is a joint project of the University of California, Los Angeles, and the Jet Propulsion Laboratory/California Institute of Technology, funded by the National Aeronautics and Space Administration. V.B.-R. is Correspondent Researcher of CONICET, Argentina, at the IAR.
References
- Bandiera, R. 2008, A&A, 490, L3 [NASA ADS] [CrossRef] [EDP Sciences] [Google Scholar]
- Barkov, M. V., Lyutikov, M., & Khangulyan, D. 2019a, MNRAS, 484, 4760 [NASA ADS] [CrossRef] [Google Scholar]
- Barkov, M. V., Lyutikov, M., Klingler, N., & Bordas, P. 2019b, MNRAS, 485, 2041 [NASA ADS] [CrossRef] [Google Scholar]
- Benaglia, P., Ishwara-Chandra, C. H., Intema, H., Colazo, M. E., & Gaikwad, M. 2020, A&A, 642, A136 [NASA ADS] [CrossRef] [EDP Sciences] [Google Scholar]
- Benaglia, P., Ishwara-Chandra, C. H., Paredes, J. M., et al. 2021, ApJS, 252, 17 [NASA ADS] [CrossRef] [Google Scholar]
- Bordas, P., & Zhang, X. 2020, A&A, 644, L4 [NASA ADS] [CrossRef] [EDP Sciences] [Google Scholar]
- Bordas, P., Zhang, X., Bosch-Ramon, V., & Paredes, J. M. 2021, A&A, 654, A4 [NASA ADS] [CrossRef] [EDP Sciences] [Google Scholar]
- Brownsberger, S., & Romani, R. W. 2014, ApJ, 784, 154 [NASA ADS] [CrossRef] [Google Scholar]
- Bykov, A. M., Amato, E., Petrov, A. E., Krassilchtchikov, A. M., & Levenfish, K. P. 2017, Space Sci. Rev., 207, 235 [CrossRef] [Google Scholar]
- Condon, J. J., Cotton, W. D., Greisen, E. W., et al. 1998, AJ, 115, 1693 [Google Scholar]
- de Vries, M., & Romani, R. W. 2020, ApJ, 896, L7 [NASA ADS] [CrossRef] [Google Scholar]
- de Vries, M., & Romani, R. W. 2022, ApJ, 928, 39 [NASA ADS] [CrossRef] [Google Scholar]
- Dinsmore, J. T., & Romani, R. W. 2024, ApJ, 976, 4 [NASA ADS] [CrossRef] [Google Scholar]
- Duchesne, S. W., Thomson, A. J. M., Pritchard, J., et al. 2023, PASA, 40, e034 [CrossRef] [Google Scholar]
- Gaensler, B. M., & Slane, P. O. 2006, ARA&A, 44, 17 [Google Scholar]
- Gupta, Y., Ajithkumar, B., Kale, H. S., et al. 2017, Curr. Sci., 113, 707 [NASA ADS] [CrossRef] [Google Scholar]
- Hui, C. Y., Huang, R. H. H., Trepl, L., et al. 2012, ApJ, 747, 74 [NASA ADS] [CrossRef] [Google Scholar]
- Jankowski, F., van Straten, W., Keane, E. F., et al. 2018, MNRAS, 473, 4436 [Google Scholar]
- Kale, R., & Ishwara-Chandra, C. H. 2021, Exp. Astron., 51, 95 [NASA ADS] [CrossRef] [Google Scholar]
- Kargaltsev, O., & Pavlov, G. G. 2008, in American Institute of Physics Conference Series, 983, 40 Years of Pulsars: Millisecond Pulsars, Magnetars and More, eds. C. Bassa, Z. Wang, A. Cumming, & V. M. Kaspi, 171 [NASA ADS] [CrossRef] [Google Scholar]
- Kargaltsev, O., Pavlov, G. G., Klingler, N., & Rangelov, B. 2017, J. Plasma Phys., 83, 635830501 [NASA ADS] [CrossRef] [Google Scholar]
- Khabibullin, I. I., Churazov, E. M., Bykov, A. M., Chugai, N. N., & Zinchenko, I. I. 2024, MNRAS, 527, 5683 [Google Scholar]
- Klingler, N., Yang, H., Hare, J., et al. 2020, ApJ, 901, 157 [NASA ADS] [CrossRef] [Google Scholar]
- Lacy, M., Baum, S. A., Chandler, C. J., et al. 2020, PASP, 132, 035001 [Google Scholar]
- Marelli, M., Mignani, R. P., De Luca, A., et al. 2015, ApJ, 802, 78 [CrossRef] [Google Scholar]
- McMullin, J. P., Waters, B., Schiebel, D., Young, W., & Golap, K. 2007, in Astronomical Society of the Pacific Conference Series, 376, Astronomical Data Analysis Software and Systems XVI, eds. R. A. Shaw, F. Hill, & D. J. Bell, 127 [NASA ADS] [Google Scholar]
- Ng, C. Y., Gaensler, B. M., Chatterjee, S., & Johnston, S. 2010, ApJ, 712, 596 [NASA ADS] [CrossRef] [Google Scholar]
- Olmi, B., Amato, E., Bandiera, R., & Blasi, P. 2024, A&A, 684, L1 [NASA ADS] [CrossRef] [EDP Sciences] [Google Scholar]
- Pacholczyk, A. G. 1970, Radio Astrophysics. Nonthermal Processes in Galactic and Extragalactic Sources [Google Scholar]
- Pavan, L., Bordas, P., Pühlhofer, G., et al. 2014, A&A, 562, A122 [NASA ADS] [CrossRef] [EDP Sciences] [Google Scholar]
- Perley, R. A., & Butler, B. J. 2017, ApJS, 230, 7 [NASA ADS] [CrossRef] [Google Scholar]
- Pletsch, H. J., Guillemot, L., Allen, B., et al. 2012, ApJ, 744, 105 [NASA ADS] [CrossRef] [Google Scholar]
- Rau, U., & Cornwell, T. J. 2011, A&A, 532, A71 [NASA ADS] [CrossRef] [EDP Sciences] [Google Scholar]
- Sault, R. J., Teuben, P. J., & Wright, M. C. H. 1995, in Astronomical Society of the Pacific Conference Series, 77, Astronomical Data Analysis Software and Systems IV, eds. R. A. Shaw, H. E. Payne, & J. J. E. Hayes, 433 [NASA ADS] [Google Scholar]
- Smith, D. A., Abdollahi, S., Ajello, M., et al. 2023, ApJ, 958, 191 [NASA ADS] [CrossRef] [Google Scholar]
- Swarup, G., Ananthakrishnan, S., Kapahi, V. K., et al. 1991, Curr. Sci., 60, 95 [Google Scholar]
- Wang, Z., Kaplan, D. L., Slane, P., Morrell, N., & Kaspi, V. M. 2013, ApJ, 769, 122 [NASA ADS] [CrossRef] [Google Scholar]
- Wright, E. L., Eisenhardt, P. R. M., Mainzer, A. K., et al. 2010, AJ, 140, 1868 [Google Scholar]
The GMRT: System Parameters and Current Status, http://www.gmrt.ncra.tifr.res.in/doc/GMRT_specs.pdf
All Figures
|
Fig. 1 Archive Chandra image of the PSR J2030+4415 field in the 0.5–7 keV energy range. Image adapted from the original produced by de Vries & Romani (2022) after merging several observations (Obs. Id. 14827, 20298, 22171–22173, 23536, 24954, 24236) obtained from April 2014 to November 2021. The blue cross marks the position of PSR J2030+4415. In the image we show only a fraction (160″) of the large-scale filament (15′) (de Vries & Romani 2022). The length and the width of the trailing PWN are 20″ and 9″, respectively. North is up and east to the left. |
| In the text | |
|
Fig. 2 uGMRT radio images of the PSR J2030+4415 field. The white cross in both images marks the position of the pulsar PSR J2030+4415. Left: 736 MHz image, with the synthesized beam shown in the bottom left. Overlaid are the contour levels at 3, 6, 9, and 12 times the rms noise (0.03 mJy beam−1). Right: 1274 MHz image, with the synthesized beam shown in the bottom left. Overlaid are the contour levels at 3, 4, 5, 6, and 7 times the rms noise (0.015 mJy beam−1). |
| In the text | |
|
Fig. 3 Archive Chandra image of the PWN PSR J2030+4415 convolved to a beam of 1″ × 1″. The overlaid white contours represent the 1274 MHz radio emission from GMRT. The contour levels are 3, 4, 5, 6, and 7 times the rms noise (0.015 mJy beam−1). The white cross marks the position of the pulsar PSR J2030+4415. |
| In the text | |
|
Fig. 4 Distribution of the spectral index and its error along the PWN. Left: spectral index image of the PWN PSR J2030+4415 using the Band 4 and Band 5 data. The common synthesized beam of 6″ × 6″ is shown in the bottom left. Right: spectral index error distribution of the PWN PSR J2030+4415 using the Band 4 and Band 5 data. The common synthesized beam of 6″ × 6″ is shown in the bottom left. |
| In the text | |
|
Fig. 5 X-ray and radio intensity profiles of PWN PSR J2030+4415 as a function of the distance from PSR J2030+4415. The cutting line that defines the profile scans crosses the pulsar position and follows the proper motion direction of the pulsar (PA= 7.2°). The grey line corresponds to 0.5–7 keV X-ray data, whereas the blue line corresponds to the radio data at 736 MHz and the green line to the 1274 MHz data, with the common synthesized beam of 6″ × 6″. The vertical red dashed line marks the pulsar position. We note that the small X-ray peaks far from the pulsar also represent significant emission. |
| In the text | |
|
Fig. 6 Environment of PSR J2030+4415 using WISE data in the mid-infrared domain. Left: PSR J2030+4415 region as seen in the 12 µm W3 band of WISE. The thin yellow line represents the 2σ contour of the GMRT 736 MHz radio emission, which matches very closely a minimum of the thermal infrared emission. The yellow compass symbol and the horizontal bar indicate the image orientation and angular scale, respectively. Right: East–west emission profile along the white dashed line of the left panel with an attempt to fit the background emission. There is a central drop in counts with respect to the dashed line, in coincidence with the PWN central axis. |
| In the text | |
Current usage metrics show cumulative count of Article Views (full-text article views including HTML views, PDF and ePub downloads, according to the available data) and Abstracts Views on Vision4Press platform.
Data correspond to usage on the plateform after 2015. The current usage metrics is available 48-96 hours after online publication and is updated daily on week days.
Initial download of the metrics may take a while.