Fig. 6
Download original image
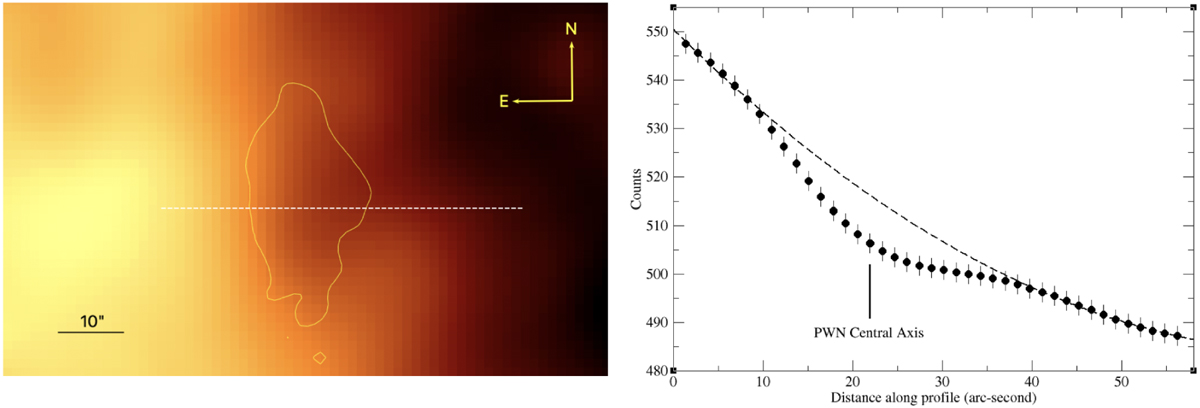
Environment of PSR J2030+4415 using WISE data in the mid-infrared domain. Left: PSR J2030+4415 region as seen in the 12 µm W3 band of WISE. The thin yellow line represents the 2σ contour of the GMRT 736 MHz radio emission, which matches very closely a minimum of the thermal infrared emission. The yellow compass symbol and the horizontal bar indicate the image orientation and angular scale, respectively. Right: East–west emission profile along the white dashed line of the left panel with an attempt to fit the background emission. There is a central drop in counts with respect to the dashed line, in coincidence with the PWN central axis.
Current usage metrics show cumulative count of Article Views (full-text article views including HTML views, PDF and ePub downloads, according to the available data) and Abstracts Views on Vision4Press platform.
Data correspond to usage on the plateform after 2015. The current usage metrics is available 48-96 hours after online publication and is updated daily on week days.
Initial download of the metrics may take a while.