Fig. 2
Download original image
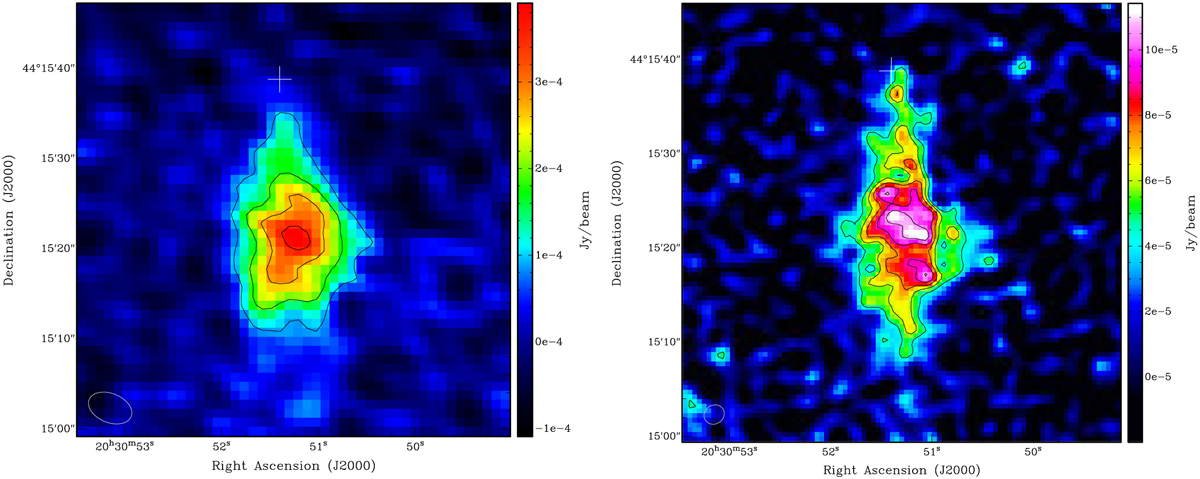
uGMRT radio images of the PSR J2030+4415 field. The white cross in both images marks the position of the pulsar PSR J2030+4415. Left: 736 MHz image, with the synthesized beam shown in the bottom left. Overlaid are the contour levels at 3, 6, 9, and 12 times the rms noise (0.03 mJy beam−1). Right: 1274 MHz image, with the synthesized beam shown in the bottom left. Overlaid are the contour levels at 3, 4, 5, 6, and 7 times the rms noise (0.015 mJy beam−1).
Current usage metrics show cumulative count of Article Views (full-text article views including HTML views, PDF and ePub downloads, according to the available data) and Abstracts Views on Vision4Press platform.
Data correspond to usage on the plateform after 2015. The current usage metrics is available 48-96 hours after online publication and is updated daily on week days.
Initial download of the metrics may take a while.