Fig. 5
Download original image
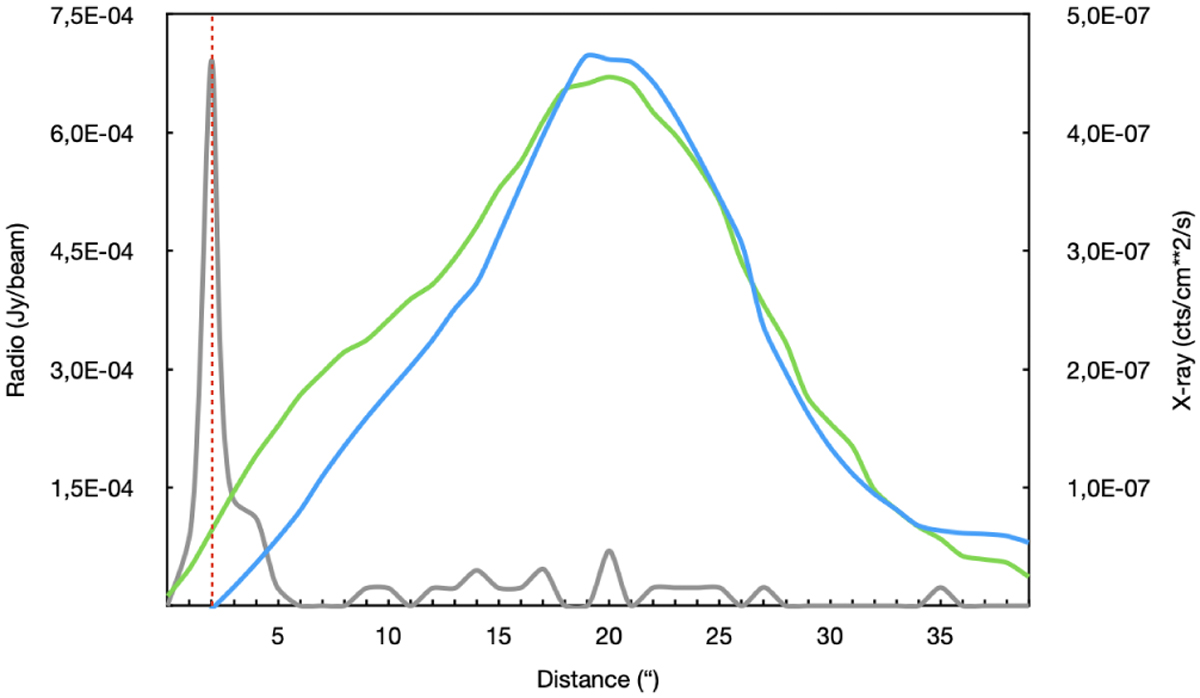
X-ray and radio intensity profiles of PWN PSR J2030+4415 as a function of the distance from PSR J2030+4415. The cutting line that defines the profile scans crosses the pulsar position and follows the proper motion direction of the pulsar (PA= 7.2°). The grey line corresponds to 0.5–7 keV X-ray data, whereas the blue line corresponds to the radio data at 736 MHz and the green line to the 1274 MHz data, with the common synthesized beam of 6″ × 6″. The vertical red dashed line marks the pulsar position. We note that the small X-ray peaks far from the pulsar also represent significant emission.
Current usage metrics show cumulative count of Article Views (full-text article views including HTML views, PDF and ePub downloads, according to the available data) and Abstracts Views on Vision4Press platform.
Data correspond to usage on the plateform after 2015. The current usage metrics is available 48-96 hours after online publication and is updated daily on week days.
Initial download of the metrics may take a while.