Fig. 1.
Download original image
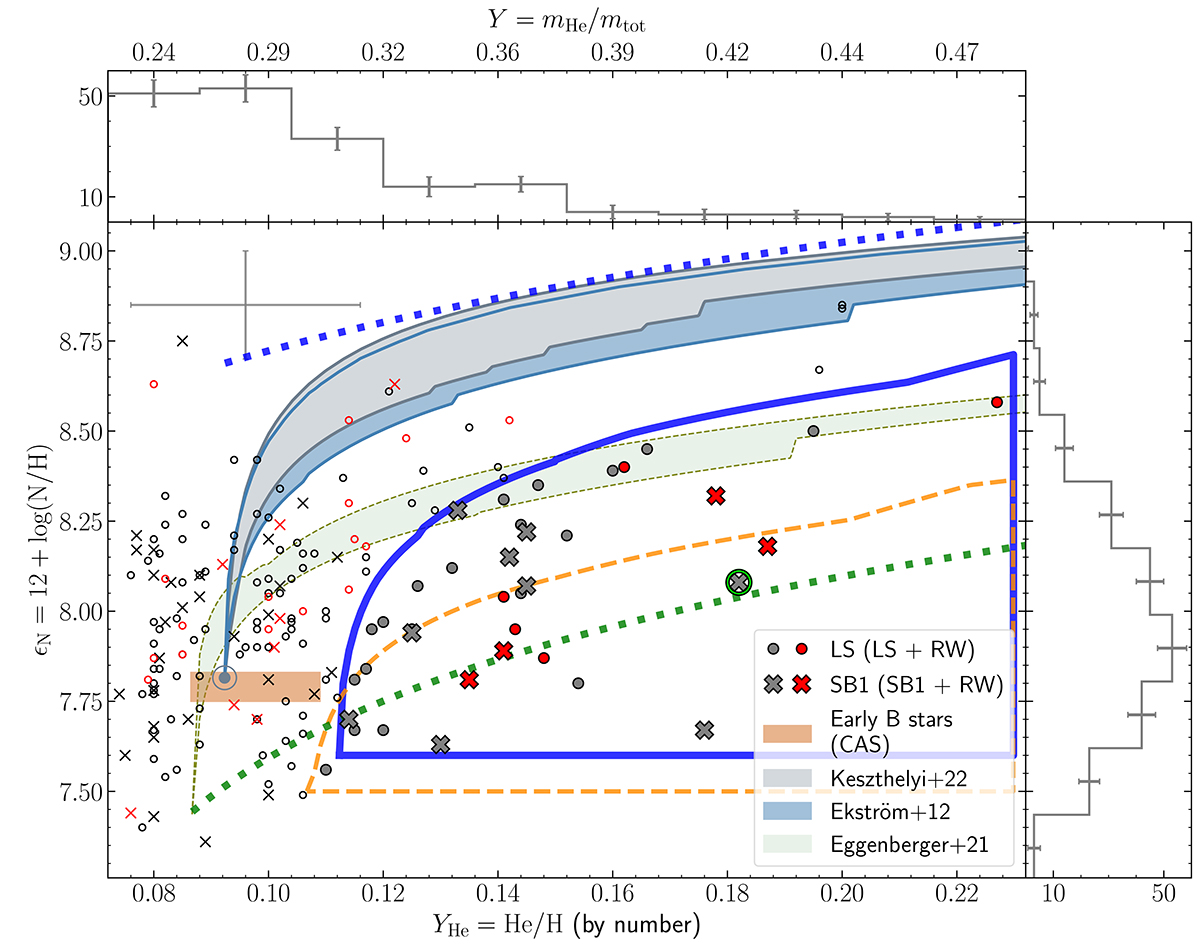
He abundance (in number fraction in the lower x-axis, and in mass fraction in the upper one) against N abundances, for a sample of 180 Galactic O-type stars with v sin i ≤ 150 km s−1. Circles and crosses indicate LS and SB1 stars, respectively, while identified runaway stars are highlighted by red symbols. Typical uncertainties in He and N abundances are marked with a gray error bar in the upper left corner. HD 226868 (optical counterpart of Cyg X-1) is surrounded by a green circle. Blue and gray shadowed strips delimit the locations of solar-abundance single-star-evolution tracks associated with GENEC vini/vcrit = 0.2 and 0.4 model computations (Ekström et al. 2012, and priv. comm.) and MESA models following Keszthelyi et al. (2022), respectively. Baseline abundances for these models (from Ekström et al. 2012) are marked with a bluish-gray dot. The green shadowed strip outlines the location of single-star evolution tracks associated with GENEC vini/vcrit = 0.4 model computations for subsolar initial chemical composition (Eggenberger et al. 2021, see further discussion in Appendix B.3). Dotted lines correspond to two extreme cases of matter mixing at the stellar surface (see Appendix C). The blue-dotted line corresponds to mixing in which CNO-equilibrium is reached for any YHe value (considered initial values from Ekström et al. 2012). The green-dotted line corresponds to the mixing of pure He with material in CNO-equilibrium (considered initial values from Eggenberger et al. 2021, see the justification for this choice in the text). The shaded brown rectangle indicates the “cosmic abundance standard” obtained for early-B stars in the solar vicinity by Nieva & Przybilla (2012). The blue and orange (with dashed line) open contours surround the star samples with N and He abundance patterns not covered by the solar-abundance evolutionary models and not covered by the subsolar-abundance evolutionary models, respectively. Further details on the rationale for including the subsolar-abundances tracks can be found in Appendix B. Top and right: Histograms of He and N abundances, respectively.
Current usage metrics show cumulative count of Article Views (full-text article views including HTML views, PDF and ePub downloads, according to the available data) and Abstracts Views on Vision4Press platform.
Data correspond to usage on the plateform after 2015. The current usage metrics is available 48-96 hours after online publication and is updated daily on week days.
Initial download of the metrics may take a while.