| Issue |
A&A
Volume 693, January 2025
|
|
|---|---|---|
| Article Number | A111 | |
| Number of page(s) | 16 | |
| Section | Stellar structure and evolution | |
| DOI | https://doi.org/10.1051/0004-6361/202452346 | |
| Published online | 07 January 2025 | |
Multiplicity of Galactic Cepheids from long-baseline interferometry
V. High-accuracy orbital parallax and mass of SU Cygni
1
Instituto de Astrofísica, Departamento de Ciencias Físicas, Facultad de Ciencias Exactas, Universidad Andrés Bello, Fernández Concha 700, Las Condes, Santiago, Chile
2
French-Chilean Laboratory for Astronomy, IRL3386, CNRS, Casilla36-D, Santiago, Chile
3
Smithsonian Astrophysical Observatory, MS 4, 60 Garden Street, Cambridge, MA 02138, USA
4
LESIA, Observatoire de Paris, Université PSL, CNRS, Sorbonne Université, Université Paris Cité, 5 place Jules Janssen, 92195 Meudon, France
5
Univ. Paris Diderot, Sorbonne Paris Cité, 5 place Jules Janssen, 92195 Meudon, France
6
Astronomy Department, University of Michigan, 941 Dennison Bldg, Ann Arbor, MI 48109-1090, USA
7
Space Telescope Science Institute, 3700 San Martin Drive, Baltimore, MD 21218, USA
8
The CHARA Array of Georgia State University, Mount Wilson, CA 91023, USA
9
European Southern Observatory, Karl-Schwarzschild-Str. 2, 85748 Garching, Germany
10
Centrum Astronomiczne im. Mikołaja Kopernika, PAN, Bartycka 18, 00-716 Warsaw, Poland
11
Universidad de Concepción, Departamento de Astronomía, Casilla 160-C, Concepción, Chile
12
Astrophysics Group, Department of Physics & Astronomy, University of Exeter, Stocker Road, Exeter EX4 4QL, UK
13
Institut de Planetologie et d’Astrophysique de Grenoble, Grenoble 38058, France
⋆ Corresponding author; alexandre.gallenne@gmail.com
Received:
23
September
2024
Accepted:
5
November
2024
Aims. We aim to accurately measure the dynamical mass and distance of Cepheids by combining radial velocity measurements with interferometric observations. Cepheid mass measurements are particularly necessary for solving the Cepheid mass discrepancy, while independent distance determinations provide a crucial test of the period–luminosity relation and Gaia parallaxes.
Methods. We used the multi-telescope interferometric combiner, the Michigan InfraRed Combiner (MIRC) of the Center for High Angular Resolution Astronomy (CHARA) Array, to detect and measure the astrometric positions of the high-contrast companion orbiting the Galactic Cepheid SU Cygni. We also present new radial velocity measurements from ultraviolet spectra taken with the Hubble Space Telescope. The combination of interferometric astrometry with optical and ultraviolet spectroscopy provided the full orbital elements of the system, in addition to component masses and the distance to the Cepheid system.
Results. We measured the mass of the Cepheid, MA = 4.859 ± 0.058 M⊙, and its two companions, MBa = 3.595 ± 0.033 M⊙ and MBb = 1.546 ± 0.009 M⊙. This is the most accurate existing measurement of the mass of a Galactic Cepheid (1.2%). Comparing with stellar evolution models, we show that the mass predicted by the tracks is higher than the measured mass of the Cepheid, which is similar to the conclusions of our previous work. We also measured the distance to the system to be 926.3 ± 5.0 pc, obtaining an unprecedented parallax precision of 6 μas (0.5%), which is the most precise and accurate distance for a Cepheid. This precision is similar to what is expected by Gaia for its last data release (DR5 in ∼2030) for single stars fainter than G = 13, but is not guaranteed for stars as bright as SU Cyg.
Conclusions. We demonstrate that evolutionary models remain incapable of accurately reproducing the measured mass of Cepheids, often predicting higher masses for the expected metallicity, even when factors such as rotation or convective core overshooting are taken into account. Our precise distance measurement allowed us to compare predictions from some period–luminosity relations. We find a disagreement of 0.2–0.5 mag with relations calibrated from photometry, while relations calibrated from a direct distance measurement are in better agreement.
Key words: binaries: close / stars: distances / stars: fundamental parameters / stars: variables: Cepheids
© The Authors 2025
 Open Access article, published by EDP Sciences, under the terms of the Creative Commons Attribution License (https://creativecommons.org/licenses/by/4.0), which permits unrestricted use, distribution, and reproduction in any medium, provided the original work is properly cited.
This article is published in open access under the Subscribe to Open model. Subscribe to A&A to support open access publication.
1. Introduction
One of the most discussed topics in astrophysics today is the tension between the Hubble constant H0 determined for the present Universe based on Cepheids and Type Ia supernovae and that from the early Universe based on Planck satellite observations of the cosmic microwave background (see e.g. Freedman 2021). Extensive efforts are being made to reduce the uncertainties involved, as the discrepancy hints at possible new physics. For Cepheids (the foundation of the local determination), the Leavitt (period–luminosity) law needs to be calibrated to the highest accuracy and we need to understand the physics of Cepheid pulsation and evolution as thoroughly as possible. A crucial test of our understanding is the luminosity at the Cepheid stage for a given stellar mass. Evolutionary tracks are beginning to incorporate new insights related to rotation in stellar interiors from astroseismology in phases leading up to the Cepheid stage. Thus, Cepheid masses of the highest accuracy coupled with very accurate luminosities (partly through Gaia, among other approaches) are a stringent test of state-of-the-art stellar modelling.
It has been known since the first hydrodynamic modelling of Cepheid pulsation in the 1960s that masses inferred from pulsation differ from those derived from evolutionary calculations. This difference has now been reduced to ≤20%. The most cited scenarios to explain this discrepancy are a mass-loss mechanism during the evolution of Cepheids, convective core overshooting, and rotation during the main sequence stage (Anderson et al. 2014; Neilson et al. 2011; Keller 2008; Bono et al. 2006), but none of these agree with the measured dynamical mass (Evans et al. 2024b, 2018a). This discrepancy points to an uncomfortable gap in our understanding of objects that are important to the H0 tension. While calibration of Cepheid luminosities will be significantly improved in the final Gaia release, masses can only be directly measured in binary systems, and hence only a limited number are available.
There are currently only two feasible ways to directly measure masses for several non-eclipsing Cepheids. High-resolution spectra in the ultraviolet (UV) allow the orbital velocity amplitude of hot companions of Cepheids to be measured. Combining this with the orbital amplitude of the Cepheid from the ground-based orbit provides the mass ratio. In addition, interferometry has resolved a number of systems, providing the semi-major axis (a1 + a2) and the inclination. V1334 Cyg is a system for which complete observational data are available: an interferometric orbit and a mass ratio from the orbital velocity amplitudes for the Cepheid and the companion (Gallenne et al. 2018). For this combination, the masses of both stars and their distances can be determined, resulting in the most accurate mass and distance to a Galactic Cepheid (MA = 4.29 ± 0.13 M⊙, d = 720.4 ± 7.8 pc).
The present paper is part of a series discussing binary and multiple systems containing Cepheids, and what can be inferred from these systems regarding Cepheid masses. SU Cyg = HD 186688 = HR 7518 is a V = 6.44 mag Cepheid star with a period of 3.85 d. It has an asymmetric light curve and a large pulsation amplitude that is consistent with pulsation in the fundamental mode. Hellerich (1919) found orbital motion in the system containing the Cepheid SU Cyg. An orbit was first determined by Evans (1988). Ground-based velocities of the Cepheid were then combined with velocities of the companion from the International Ultraviolet Explorer (IUE) satellite by Evans & Bolton (1990). The companion itself was found to be a short-period binary. This produced a dynamical lower limit to the mass of the Cepheid of 5.9 ± 0.4 M⊙. The stars in the system are thus A (the Cepheid), Ba (the hottest star), and Bb. Inspection of a low-resolution IUE spectrum showed that the star Ba has a strong Ga II feature at 1400 Å, indicative of a chemically peculiar HgMn star (Evans 1995). This is consistent with a rotation rate slowed to synchronise with the orbital period of 4.67 d. This was further discussed by Wahlgren & Evans (1998).
In this paper, we revisit the SU Cyg system using new UV spectra from the Hubble Space Telescope (HST) together with new interferometric observations with the goal of measuring accurate dynamical masses and the distance. We present the observations and the data reduction process in Sect. 2. In Sect. 3 we detail the data analysis used to extract radial velocities and astrometric motion, which we then used for a global orbital fit, as presented in Sect. 4. We then discuss our results in Sect. 5 and outline our conclusions in Sect. 6.
2. Observations and data reduction
2.1. Ultraviolet spectra
As with many Cepheids, the hottest star in the SU Cyg system is the companion. The hottest star outshines the Cepheid in the ultraviolet, and so the velocity of the companion can be measured on HST Space Telescope Imaging Spectrograph (STIS) spectra.
We obtained ultraviolet spectra with the STIS instrument on board the HST in Cycles 22 and 23 (PI: Gallenne) and 28 and 29 (PI: Evans). The high-resolution echelle mode E140H was used in the wavelength region 1163–1357 Å. The reduction procedure is described in detail in Evans et al. (2018b). The echelle orders are combined into a 1D spectrum using an appropriate blaze function (Baer et al. 2018).
The velocity differences between the spectra were measured using an IDL cross-correlation routine, as described in Evans et al. (2018b). The first spectrum in the series was arbitrarily selected for the velocity difference anchor. Cross-correlation was done in wavelength segments of typically 10 Å in width. Because SU Cyg B is a sharp-lined HgMn star with many lines, the agreement between segments is very good, as shown in Fig. 1.
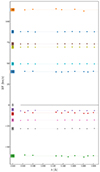 |
Fig. 1. Velocities in the wavelength segments for the STIS observations. The observation number from Table 2 is on the left. Velocities are determined by cross-correlation with the first observation, which is shown as the line at ΔVr = 0. The average velocity for each observation is shown as a dashed line. |
On the other hand, in spectra with more typical broad lines, such as V1334 Cyg and S Mus, interstellar lines can be used to check the velocity shift zero-point variation due to the positioning of the star within the aperture (Proffitt et al. 2017). In SU Cyg, this cannot be done because the spectrum is full of lines with similar widths to interstellar lines. Internal errors depend largely on the number of lines available and also the rotational velocity of the star. For SU Cyg B, internal consistency between segments is excellent, as shown in Fig. 1.
The observation began with an acquisition peakup exposure (the so-called ACQ/Peak) to centre the star in the slit. Nominally, an ACQ/Peak is accurate to 5% of the slit width. We used the 0.2X0.09 aperture, and the plate scale of the E140H is 0.047″/pixel in the dispersion direction. A nominal centring accuracy of 0.05 × 0.09/0.047 is thus about 0.1 pixels. One pixel is λ/228000, and so one-tenth of a pixel would give about 0.1c/228000 or about 0.13 km s−1, which is probably not the limiting accuracy of the wavelength scale. Instead, the accuracy is probably limited by the stability of the bench and the accuracy of the wavelength calibration. We added extra-deep calibration that bracketed our exposures to help correct for any drifts. The CALSTIS pipeline software then interpolates the shift in the velocity alignment as measured from the two lamp exposures to the mean time of the observation. Even if the actual shift in the bench is highly non-linear over the course of an observation, any additional error should be less than half the value of the shift between the two wavecals. We find that the average shift in the position of the lamp spectrum between the leading and trailing wavecal is equivalent to a velocity change of about −0.28 ± 0.23 km s−1, with the most extreme shift being about −0.7 km s−1. The small scatter in the STIS velocities around the best-fit model in the following section (Fig. 2) also confirms the accuracy of the velocities.
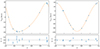 |
Fig. 2. Fit of the long and short orbital period of the STIS radial velocities. |
2.2. Interferometry
We collected long-baseline optical interferometric data at Georgia State University’s Center for High Angular Resolution Astronomy (CHARA) Array (ten Brummelaar et al. 2005) located at Mount Wilson Observatory. The CHARA Array consists of six 1m aperture telescopes in a Y-shaped configuration with two telescopes along each arm, oriented to the east (E1, E2), west (W1, W2), and south (S1, S2), offering good coverage of the (u, v) plane. The baselines range from 34 m to 331 m provides an angular resolution down to 0.5 mas at λ = 1.6 μm.
Data were collected with the Michigan InfraRed Combiner (MIRC, Monnier et al. 2004) before 2019 and the upgraded Michigan InfraRed Combiner-eXeter (Anugu et al. 2020) after 2019. In addition, recent improvements at CHARA include the commissioning of a new six-telescope beam combiner MYSTIC (Michigan Young STar Imager at CHARA Monnier et al. 2018; Setterholm et al. 2023) designed alongside the MIRC-X upgrade and capable of simultaneous observations. MIRC combined the light coming from all six telescopes in the H band (∼1.6 μm), with three spectral resolutions (R = 42, 150, and 400). The recombination of six telescopes gives 15 fringe visibilities and 20 closure phase measurements simultaneously, which are our primary observables. MIRC-X also combines the light from six telescopes, with spectral resolution of R = 50, 102, and 190. Our MIRC and MIRC-X observations used only the lowest spectral resolution to favour the signal-to-noise ratio (S/N). MYSTIC is a K-band instrument working similarly to MIRC-X and offering a spectral resolution of 50. The log of our observations is available in Table 1.
Journal of the observations.
We followed a standard observing procedure: we monitored the interferometric transfer function by observing a calibrator before and after our Cepheids. The calibrators were selected using the SearchCal software1 (Chelli et al. 2016) provided by the Jean-Marie Mariotti Center. They are listed in Table 1.
The data were reduced with the standard MIRC and MIRC-X pipeline2 (Monnier et al. 2007; Anugu et al. 2020). The main procedure is to compute squared visibilities and triple products for each baseline and spectral channel, and to correct for photon and readout noises. MYSTIC data are also reduced by the MIRC-X pipeline.
3. Data analysis
SU Cyg is part of a triple system, which makes its study slightly more difficult. In the following, we define the Cepheid as the primary star A, the hottest star of the companion pair as the secondary Ba, and the tertiary component as Bb.
3.1. STIS radial velocities
The radial velocities (RVs) of the companion were determined using the cross-correlation technique. No synthetic template spectrum was used; instead we estimated a velocity difference with respect to the first observation by cross-correlating each of the spectra against it. This was typically done in 11 segments of approximately 10 Å, which were inspected to optimise the features so that a feature was not divided by a boundary. Mild smoothing was included. These velocity differences are directly used in our orbital model fitting. Measurements are listed in Table 2, with internal uncertainties derived from the differences between segments.
Differential radial velocities of the component Ba.
In the ultraviolet wavelength range, the Cepheid is faint compared to its companions, and therefore the STIS velocities inform us about the orbital motion of the companions around their common centre of mass (i.e. the system B = Ba + Bb) plus the motion around the centre of mass including the Cepheid. We therefore need to disentangle the centre of mass motion of the short orbital period from the long orbital period.
To disentangle the orbital motions, we used the following model, assuming a circular short-period orbit (consistent hypothesis for such a short orbit) and therefore an argument of periapsis ωshort = 0:
![$$ \begin{aligned} V_\mathrm{B} = \gamma + K_\mathrm{B} [\cos (\omega - \pi + \nu ) + e \cos (\omega - \pi )] + K_\mathrm{Ba} \cos \nu _\mathrm{Ba} , \end{aligned} $$](/articles/aa/full_html/2025/01/aa52346-24/aa52346-24-eq1.gif)
where γ is the systemic velocity, KB the semi-amplitude of the centre of mass of B in the long orbit, KBa the semi-amplitude in the short orbit, ω the argument of periastron of the orbit of B (with π subtracted to take into account the symmetry compared to the equations in Sect. 4), ν the true anomaly of the centre of mass in the long orbit, e the eccentricity of the long orbit, and νBa the true anomaly in the short orbit.
The true anomaly is defined implicitly with the following Keplerian parameters: Porb, Tp, e (respectively for the long- and short-period orbit), and Kepler’s equation:
where E(t) is the eccentric anomaly, Tp the time of periastron passage, t the time of radial velocity observations, and Porb the orbital period. In the following, we use PL, Tp, L, PS, and Tp, S to refer to the orbital period and the time of periastron passage for the long and short orbit, respectively.
Due to the finite speed of light, we also adjusted the times of observations at each iteration to account for the light-travel-time effect (LTTE, Irwin 1952, 1959) in the short orbit. The LTTE causes apparent shifts in the timing of the RVs because light from Ba takes time to travel to us as the star moves in its short orbit (the LTTE for the long orbit is adjusted later in the global fit). More details can also be found in Konacki et al. (2010) and Zucker & Alexander (2007).
However, the RVs from STIS are differential velocities, as they were calculated by cross-correlation with the first spectrum (see Gallenne et al. 2018). Therefore, our model to fit the STIS velocities is:

As first-guess parameters, we used the values given in Evans & Bolton (1990). Figure 2 shows the disentangled long- and short-period orbital velocities, and the fitted parameters are shown in Table 3. We used a standard least-squares minimisation with errors taken from the correlation matrix. As the STIS uncertainties are only internal (mean standard deviation of segments for all the spectra), we rescaled the RV uncertainties to the mean RMS of the fit, which was of ∼0.29 km s−1. Our measured parameters are in agreement with those estimated by Evans & Bolton (1990), who performed a similar analysis using high-dispersion spectrographs from the IUE satellite. Additionally, the small residuals for the short-period orbit support our hypothesis of a circular orbit. We then analytically removed the short-period motion from the STIS velocities, which are used in our combined fit of Sect. 4.
Best-fit parameters of the STIS differential velocities of the long- and short-period orbit.
3.2. Radial velocities from the literature
At visible wavelengths, where most of the ground-based spectrographs operate, the Cepheid dominates the spectra. Therefore, RVs obtain from these observations give us information about the orbital reflex motion of the Cepheid. There are several datasets available in the literature, but some suffer from large uncertainties or large scatter in the measurements, and so we decided to not include them in the fit; this is the case for RVs from Hellerich (1919), Barnes et al. (1987), Wilson et al. (1989). The velocities from Borgniet et al. (2019) are of very good quality, but there are only 13 measurements, and these have a small orbital coverage. There is a large set of observations from Evans (1989) spanning about six years, providing a good coverage of the long orbital period. However, the mean scatter of the data is on the order of 1.6 km s−1 when fitting the orbital and pulsation motion. This is likely due to a number of changes made to the spectrograph during those six years, which might result in some residual offsets between datasets; although some corrections were made by the authors. The method used to determine the RVs may also contribute to the scatter, as Evans (1989) fitted parabola to the line cores of about 20 selected lines, which is less robust than the cross-correlation technique. Imbert (1984) obtained spectra from the CORAVEL instrument (Mayor et al. 1983) spanning about three years, which is about two times the long orbital period. The RVs were extracted using the cross-correlation technique, providing more accurate measurements. We find a mean scatter of ∼0.6 km s−1 when fitting the orbital and pulsation motion. A comparison of the Imbert and Evans datasets is displayed in Fig. 3. We chose to use the most uniform and accurate dataset and therefore used only the measurements from Imbert (1984) for our simultaneous fit, which is presented in the following section.
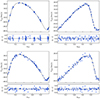 |
Fig. 3. Fit of the orbital and pulsation motion of the Cepheid using data from Imbert (1984) (top panels) and Evans (1989) (bottom panels). The fitted model is represented with a black line and the observations are shown as blue dots. |
3.3. Astrometry
To detect the companion (or, more precisely, the centre of light of the binary companion), we used the interferometric tool CANDID3 (Gallenne et al. 2015). The main function allows a systematic search for companions by performing an N × N grid of fits, the minimum required grid resolution of which is estimated a posteriori in order to find the global minimum in χ2. The tool delivers the binary parameters, namely the flux ratio f and the relative astrometric separation (Δα, Δδ), together with the uniform-disk angular diameter θUD of the primary star (the Cepheid). The angular diameter of the companion is assumed to be unresolved by the interferometer. The significance of the detection, nσ, is also given, which takes into account the reduced χ2 and the number of degrees of freedom4. These are listed in Table 4, together with our measured astrometric positions.
Relative astrometric position of the SU Cyg companion.
There were poor seeing conditions when the 2016 data were obtained; we therefore combined the two nights to detect the companion and used only the closure phase signal, which is less sensitive to the atmospheric variations. We fixed the angular diameter to the average diameter measured from all our observations (see the following paragraph). The observations obtained on the night of 2020 June 30 also suffered from poor observing conditions, and so we decided to combine them with observations on the following night to increase the S/N, again using only the closure phases. We fixed the angular diameter to the average value given by fitting the V2. The data taken during two nights in 2022 suffered from vibrations on the delay line systems, which affects mostly the visibilities, as the order of magnitude is less than a wavelength. We therefore also only used the closure phase with a fixed flux ratio. To increase the detection level, we combined these two nights for MIRC-X and MYSTIC. Both instruments provide identical detection of the companion (see Table 4).
Uncertainties on the fitted parameters are estimated using a bootstrapping function (bootstrap on the observing time and baselines). From the distribution, we took the median value and the maximum value between the 16th and 84th percentiles as uncertainty for the flux ratio and angular diameter. For the fitted astrometric position, the error ellipse is derived from the bootstrap sample (using a principal component analysis). The angular diameters and astrometric separations were then divided by factors of 1.0014 ± 0.0006 for MIRC, 1.0054 ± 0.0006 for MIRC-X, and 1.0067 ± 0.0007 for MYSTIC (J.D. Monnier, private communication) to take into account the uncertainty from the wavelength calibration. This is equivalent to adjusting the respective wavelengths reported in the OIFITS files by the same factors.
The uncertainty on the measurements of angular diameter was estimated using the conservative formalism of Boffin et al. (2014), as follows:

where Nsp is the number of spectral channels, σstat2 the uncertainty from the bootstrapping, and δλ = 0.07%, as mentioned above. We measured a mean uniform disc diameter in the H band of θUD = 0.323 ± 0.061 mas (the standard deviation is taken as the uncertainty), which is in agreement with the value estimated by Trahin (2019) from a global fit. We also estimated an average flux ratio in H of fH = 1.68 ± 0.24%.
As the companion is itself a binary, the astrometry we measured is that of the photocentre of the companion pair. For stars with equal brightness, the photocentre would be in the middle of the two stars and would follow a simple elliptical orbit around the Cepheid. However, this is not the case here because Ba is a B7.5V star and Bb has a spectral type of later than A0V, which means that the photocentre has a wobble around its elliptical orbit around the Cepheid. The amplitude of the wobble can be roughly quantified from the mass ratio and contrast between the stars. Using the spectral type calibration from Pecaut & Mamajek (2013), the companions have masses of close to 3.6 M⊙ and ≤2.2 M⊙, respectively, for Ba and Bb, and a magnitude difference in ΔH of ∼1.1 mag. The semi-major axis aph of the photocentre orbit of the companion pair can be estimated with
where ashort is the semimajor axis of the short orbit in arcseconds, and MBa and MBb are the mass of each component. ashort can also be estimated from the centre of mass equation:
where aBa and aBb are the distances between the centre of mass and the stars Ba and Bb, respectively. Using aBa from Table 3, the inclination of 80° (estimated a posteriori; see Sect. 4), the Gaia distance of 1000 pc and the predicted masses, we estimated ashort ∼ 0.1 mas, and a semi-major axis of the photocentre of aph ∼ 11 μas. This is slightly below our average astrometric precision. As a conservative measure, we added an additional uncertainty of 15 μas to our astrometry.
4. Orbital fitting
We performed a combined fit of the interferometric orbit and RVs of the Cepheid and its companion pair, that is, of the long period orbit. This is similar to the work we did in Gallenne et al. (2018) for the Cepheid V1334 Cyg. The fit includes three models with shared parameters for our three data sets: the first models the Cepheid RVs only, that is, the orbit around the system barycentre and the pulsation. The second models the STIS radial velocities, that is, the orbit of the centre of mass of the companion pair around the system barycentre with the Cepheid. The last model fits the relative astrometric orbit of the companion pair determined from interferometry (MIRC data).
Our radial velocity model of the primary star, the Cepheid, is defined as

with the orbital radial velocity VA, orb and the pulsation velocity Vpuls, which are expressed as
![$$ \begin{aligned} V_\mathrm{A,orb}&= K_\mathrm{A} [\cos (\omega + \nu ) + e \cos \omega ] + \gamma , \end{aligned} $$](/articles/aa/full_html/2025/01/aa52346-24/aa52346-24-eq9.gif)
![$$ \begin{aligned} V_\mathrm{puls}&= \sum _{i=1}^n [A_i \cos (2\pi i \phi _\mathrm{puls} ) + B_i \sin (2\pi i \phi _\mathrm{puls} )], \end{aligned} $$](/articles/aa/full_html/2025/01/aa52346-24/aa52346-24-eq10.gif)
where KA is the semi-amplitude of the Cepheid’s orbit due to the secondary companions, ω is the argument of periastron of the companion pair orbit, ν is the true anomaly of the companions, e is the eccentricity of the orbit, γ is the systemic velocity, the pulsation phase ϕpuls = (t − T0)/Ppuls (modulo 1), T0 is the reference epoch (usually defined at the maximum brightness), and (Ai, Bi) is the amplitude of the Fourier series. The true anomaly is defined implicitly with the three Keplerian parameters, namely Porb, Tp, and e, and Kepler’s equation:
where E(t) is the eccentric anomaly, Tp the time of periastron passage, t the time of radial velocity observations, and Porb the (long) orbital period.
Following the linear parametrization developed in Wright & Howard (2009) for VA, orb, and including now the pulsation, our model can be simplified to
where we restricted the Fourier series to n = 4. The parameters C1, C2, and V0 are related to the Keplerian parameters through the relations (Wright & Howard 2009):


which can be converted back with (ω is chosen so that sin ω has the sign of the numerator):


The fitted parameters are therefore defined as (C1, C2, V0, A1, B1, A2, B2, Porb, Tp, e, Ppuls). T0 is kept fixed in the fitting process to avoid degeneracy with Tp, and its value is taken from Trahin (2019).
For the second model, we used the short-orbit-corrected STIS spectra from Sect. 3.1, which refer to the relative radial velocities of the companion pair (named BC here) in their long orbit with the Cepheid. These RVs can be parameterised with:

![$$ \begin{aligned} V_\mathrm{B}&= \frac{K_\mathrm{A} }{q} [\cos (\omega + \nu ) + e \cos \omega ] + \gamma ,\end{aligned} $$](/articles/aa/full_html/2025/01/aa52346-24/aa52346-24-eq21.gif)
where q is the mass ratio and t0 is the time of the first STIS measurement. This adds the new parameter, q, as a fitted parameter. We also added an instrument zero-point offset zp for the STIS velocities as a fitted parameter.
Finally, the astrometric positions of the companion pair as measured from interferometry are modelled with the following equations:
![$$ \begin{aligned} \Delta \alpha&= r \,[ \cos \Omega \cos (\omega + \nu ) - \cos i \sin \Omega \sin (\omega + \nu ) ], \end{aligned} $$](/articles/aa/full_html/2025/01/aa52346-24/aa52346-24-eq23.gif)
![$$ \begin{aligned} \Delta \delta&= r \,[ \sin \Omega \cos (\omega + \nu ) + \cos i \cos \Omega \sin (\omega + \nu ) ], \end{aligned} $$](/articles/aa/full_html/2025/01/aa52346-24/aa52346-24-eq24.gif)
where a is the angular semi-major axis in arcseconds, Ω is the position angle of the ascending node, and i is the orbital inclination. The true anomaly ν and the separation r at a given time t are calculated as:

where the eccentric anomaly E is calculated by solving Kepler’s equation, as above.
At each iteration, the times of observation of the RV and interferometric observations were adjusted to account for the LTTE in the long orbit.
The distance and masses are then given by:


where KB is the semi-amplitude of the companion pair, aau is the linear semi-major axis in astronomical units (au), d is the distance to the system, and MA and MB are the masses of the Cepheid and the two companions, respectively.
The combined fit is performed using a Monte Carlo Markov Chain (MCMC) technique5 to fit all model parameters characterising the standard orbital elements and the pulsation of the Cepheid. As a starting point for our 100 MCMC walkers, we performed a least squares fit using spectroscopic orbital values from Evans & Bolton (1990) as first guesses, while a, i, and Ω were set to 3 mas, 50°, and 50°, respectively. We then ran 100 initialisation steps in order to thoroughly explore the parameter space and reach a stationary distribution. For all cases, the chain converged before 50 steps. Finally, we used the last position of the walkers to generate our full production run of 1000 steps, discarding the initial 50 steps. All the orbital elements are estimated from the distribution by taking the median value, and the maximum value between the 16th and 84th percentiles was taken as the uncertainty (although the distributions were roughly symmetrical). As a conservative measure, we also quadratically added a 0.25% error to the distance uncertainty due to the wavelength calibration of the MIRC instrument (although it is likely < 0.25%, as mentioned in Sect. 3.3).
Our best fit is shown in Fig. 4. We determined a distance of d = 926.3 ± 5.0 pc (±0.5%), which is the most accurate model-independent distance of a Cepheid, and is slightly more accurate than the previous measurement of the distance of V1334 Cyg performed by Gallenne et al. (2018). This corresponds to a parallax of ϖ = 1.080 ± 0.006 mas. We also determined the masses with high accuracy, obtaining MA = 4.859 ± 0.058 M⊙ (1.2%) and MB = 5.141 ± 0.041 M⊙ (0.8%), with the primary star being the Cepheid. The other derived orbital and pulsation parameters are listed in Table 5, with the posterior distribution from our MCMC analysis displayed in Fig. 5. We found a zero-point offset of zp = −0.35 ± 0.23km s−1 for the STIS velocities.
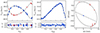 |
Fig. 4. Result of our combined fit. Left: Fitted (solid lines) and measured primary (blue dots) and secondary (red dots) orbital velocity. Middle: Fitted (solid line) and extracted (blue dots) pulsation velocity. Right: Relative astrometric orbit of the companion pair. |
 |
Fig. 5. Corner plots of the Markov chain Monte Carlo posterior distributions produced from emcee for the long period orbit. |
Final estimated parameters of the SU Cyg system.
5. Discussion
5.1. The Cepheid distance
This is the second Cepheid with the most precise and accurate orbital parallax measured to 1% using a combination of interferometry and space- and ground-based spectroscopy. In Gallenne et al. (2018), we measured the orbital parallax of the Cepheid V1334 Cyg with an accuracy of 1% using the same method and showed the disagreement with the most used period-luminosity (P-L) relations and a deviation of 3.6σ with the Gaia DR2. Here, we performed a similar analysis with the Cepheid SU Cyg. Gaia DR3 provides a parallax of 1.000 ± 0.052 mas, including a zero-point correction of −0.028 mas (Lindegren et al. 2021), which is in agreement at 1.5σ with our measurements, but our uncertainty is approximately nine times better. Because the DR3 parallax has large uncertainties, the zero-point correction has no effect on the agreement with our distance estimate. The renormalised unit weight error (RUWE) indicator of the Gaia astrometric fit is 3.44, meaning that the astrometric solution is problematic, which is likely due to the orbital motion of the Cepheid. Wahlgren & Evans (1998) identified the companion B as a HgMn type star of B8V spectral type, giving a magnitude difference with the Cepheid of ΔV ∼ 3 mag (Evans 1995). Using our measured orbital parameters and this contrast, we calculated the orbit of the photocentre, which we display in Fig. 6. We see that its semi-major axis is ∼1.4 mas and certainly impacts the Gaia single-star model solution. As the Cepheid is redder than its companion, the magnitude difference in the G band is slightly larger than the estimate in the V band, of the order of +0.1–0.2mag, leading us to expect a similar bias in the G-band parallax. In addition, the orbital period is close to one year. Unfortunately, there is no information in the non-single stars catalogue of Gaia for this system (Halbwachs et al. 2023). In addition, the Cepheid is in the bright-star magnitude range of Gaia, suffering from saturation effects in the detector, which alter the astrometric performances of Gaia.
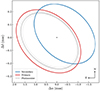 |
Fig. 6. Orbits of SU Cyg A (blue) and its companion B (red) around their common centre of mass. The average virtual orbit of the photocentre of the system is shown as a dashed black ellipse. The grey ellipses represent the maximum and minimum shifts in the photocentre relative to the average position, which are caused by the brightness variations of the Cepheid during its pulsation cycle. |
Our precise and independent distance measurement also provides an independent check of the P-L relations for fundamental-mode Cepheids, as SU Cyg is classified as pulsating in its fundamental mode (see e.g. Clementini et al. 2019; Luck 2018). A reliable method to determine whether a star is in the fundamental or first overtone mode is to examine the period–radius relation, which is notably precise. According to the empirical relation from Gallenne et al. (2017), the prediction for a fundamental mode is ∼34 R⊙, which aligns well with our estimate of 31.9 ± 6.0 R⊙. Thus, the Cepheid is consistent with being a fundamental mode pulsator. We selected a sample of published relations in the V- and K-band filters, as they are the most frequently used photometric bands (Sandage et al. 2004; Fouqué et al. 2007; Benedict et al. 2007; Storm et al. 2011; Groenewegen 2013, 2018; Breuval et al. 2020). For each tested P-L relation, we determined the predicted absolute magnitudes for P0, which are represented in Fig. 7 as black dots. We adopted the scatter of each relation given by the authors as uncertainties, as this better represents the observed intrinsic dispersion (the width of the instability strip is the dominating uncertainty in the P-L relations). We derived the absolute magnitude with the commonly used relation of Mλ = mλ − Aλ − 5 log d + 5, where mλ is the apparent magnitude at wavelength λ, Aλ is the interstellar absorption parameter, and d is the distance to the star. We corrected for the interstellar extinction using AV = 3.23E(B − V) and AK = 0.119AV (Fouqué et al. 2007), with E(B − V) = 0.109 ± 0.006 (Trahin et al. 2021). For the V band, we estimated the weighted mean apparent magnitude using a periodic cubic spline fit of four different published light curves (Berdnikov 2008; Kiss 1998; Moffett & Barnes 1984; Szabados 1977). The curve is shown in Fig. 8. We determined the weighted mean de-reddened magnitude m0, V = 6.602 ± 0.024 mag, where the total uncertainty is estimated from the standard deviation of the residual values. In the near-infrared (NIR) we used the mean apparent magnitude of mK = 5.307 ± 0.015 mag from Monson & Pierce (2011), which they determined from the NIR light curve. We estimated a de-reddened magnitude of m0, K = 5.285 ± 0.015 mag.
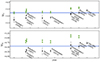 |
Fig. 7. Comparison between the absolute magnitudes of SU Cyg predicted from P-L relations in the literature (black dots) and the present distance measurement (blue areas), in two photometric bands. The blue areas represent the measured absolute magnitude after correcting for the flux contamination from the companion. The green triangles represent the absolute magnitudes determined from P-L relations from the literature using a fundamentalised pulsation period, with the downwards- and upwards-pointing triangles showing that for the longest (5.757 d) and shortest (5.455 d) converted periods. We see that only modern-era P-L calibrations (including Gaia) seem to correctly predict the luminosity of SU Cyg. |
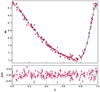 |
Fig. 8. Fitted V-band light curve of SU Cyg. |
We then combined this with our measured distance to estimate the absolute magnitude Mλ, for which the total error bar includes the uncertainties on d, Aλ, and mλ. Figure 7 shows the difference between the Mλ of SU Cyg (red area) and the values predicted from the P-L relations in the literature (black dots). However, the contribution of the companion must be subtracted from the magnitudes. To correct for the flux contamination of the companion, we used the average magnitude difference between the components estimated in V by Evans (1995), that is, ΔV = 3 mag, and we used our measured H-band average flux ratio from interferometry for the K band, that is, we assumed ΔK = ΔH = 4.44 ± 0.16 mag. With the distance calculated in the present study, we can estimate the mean corrected absolute magnitudes of the Cepheid to be MV(cep) = −3.23 ± 0.03 mag, MH(cep) = −4.50 ± 0.02 mag, and MK(cep) = −4.55 ± 0.02 mag. We note that we assume a similar flux ratio in H and K, but this is a good approximation as the companion is rather faint in the NIR and our MIRCX and MYSTIC observations provide similar flux ratios in the H and K bands, respectively (see Table 4). From the magnitude differences, absolute magnitudes for the companion pair can also be derived: we find MV(B) = −0.22 ± 0.11 mag, MH(B) = −0.07 ± 0.16 mag, and MK(B) = −0.11 ± 0.16 mag. The spectral type of B8V identified by Evans (1995) for the companion Ba corresponds to an absolute magnitude of MV(Ba) ∼ 0.0 mag (Pecaut & Mamajek 2013)6, which when combined with MV(B) gives a flux ratio of fBb/fBa ∼ 22% in V, giving an absolute magnitude for the component Bb of MV(Bb) ∼ 1.6 mag. This would correspond to a A3V-A4V spectral type (Pecaut & Mamajek 2013), in agreement with the suggestion of Evans (1995). The expected masses from such spectral types are about 3.4 M⊙ and 1.9 M⊙, respectively, for Ba and Bb.
The blue area in Fig. 7 shows the absolute magnitudes of the Cepheid corrected for flux contamination. We see that only the relations based on direct distance estimates are in acceptable agreement (< 1.4σ) with our measured corrected absolute magnitude of the Cepheid. This small discrepancy for Gaia can be explained by the fact that the measurements are still not accurate and suffer from various effects for pulsating stars (chromaticity correction, saturation, etc.), in addition to the binarity effect, which has not yet been taken into account. The P-L relation from Benedict et al. (2007) based on the HST Fine Guidance Sensor parallax is at 1.8σ and 2.4σ, respectively, in V and K. Breuval et al. (2020) show very good agreement, where we used the Gaia DR2 parallaxes of wide companions of Cepheids or their host open cluster as a proxy for the Cepheid distances, which are thought to be less prone to systematic errors. The other relations based on photometric measurements, which were calibrated using the Baade-Wesselink (BW) method (Baade 1926; Wesselink 1946) to determine the distances of Cepheids, are in agreement at 1.5 − 3.3σ in V and 1.2 − 2.5σ in K with our measured luminosity.
SU Cyg seems brighter than expected, that is, by ∼0.15 mag in V and ∼0.08 mag in K. One explanation would be the presence of a circumstellar envelope (CSE), which we know exists around other Cepheids (Kervella et al. 2006; Mérand et al. 2006; Gallenne et al. 2012, 2013; Hocdé et al. 2020a, 2021; Gallenne et al. 2021). The infrared excess is similar to the findings of Hocdé et al. (2020b), who estimated an excess of ∼0.04 mag for this Cepheid using a multi-wavelength global analysis with the SPIPS code (SpectroPhoto-Interferometry of Pulsating Stars Mérand et al. 2015) and a simple power-law parameterisation. However, this model assumes dust emission and no excess for λ < 1.2 μm. In Hocdé et al. (2020b), we also modelled the CSE emission with a shell of ionised gas to allow a deficit or excess in the visible. However, this model showed a deficit in the visible, that is, an absorption instead of an emission, and no excess in K. Therefore, no CSE models could explain the possible offset and reconcile the photometry-based P-L relations.
Another explanation would be an incorrect estimate of the pulsation period, in the sense that the Cepheid does not pulsate in its fundamental mode but instead in its first overtone mode. To test this hypothesis, we can assume that the pulsation period we measure is the first overtone and we can convert it to a fundamental mode. Several works exist on this topic for Milky Way and Magellanic Clouds Cepheids, but there is still no consensus about a good empirical or theoretical relation to ‘fundamentalise’ the first overtone period (Alcock et al. 1995; Feast & Catchpole 1997; Kovtyukh et al. 2016; Szilàdi et al. 2018; Pilecki et al. 2021, 2024). The most commonly used relation is that of Alcock et al. (1995) who base their findings on Large Magellanic Cloud (LMC) Cepheids, and estimated the ratio of the first overtone to the fundamental period as P1/P0 = 0.720 − 0.027log P0, while the latest relation is P0 = P1(1.367 + 0.079log P1) from Pilecki (2024) based on Milky way (MW) Cepheids. All of these published relations provide a fundamentalised period for SU Cyg of between 5.434 and 5.757 days, but none of these are in agreement with our measured value. Figure 7 shows the recalculated values of the P-L relation using 5.434 days and 5.757 days, which are represented by down- and upwards-pointing triangles, respectively. In V, the photometric-based relation would be in agreement, but the relations based on the Gaia parallaxes are now not consistent. In K, all of the above relations would be at several σ from the measurements. Based on this, we can confirm that SU Cyg must pulsate in its fundamental mode, and the pulsation mode cannot be the reason for the discrepancy between the predicted and measured luminosity. Finally, the projection factor presents a significant challenge in the BW method and may contribute to this offset. Reducing its value by approximately 10% could align the predictions with those from Gaia.
5.2. The Cepheid mass and its companions
We measured a very precise dynamical mass for the Cepheid and the companion pair, respectively, with precision at the 1.2% and 0.8% level, respectively. To compare the dynamical mass of the Cepheid with the evolutionary models, we used the average effective temperature Teff = 6165 ± 50 K and radius R = 40.6 ± 0.8 R⊙ determined by Trahin (2019), who used the SPIPS algorithm to combine all types of available data for a variable star (multi-band and multicolour photometry, radial velocity, effective temperature, and interferometric measurements) in a global modelling of the stellar pulsation. We determined a luminosity of L = 2138 ± 109 L⊙, which we compared to the PARSEC (Bressan et al. 2012; Nguyen et al. 2022; Costa et al. 2019) and Geneva stellar evolutionary tracks. Both models follow standard mixing-length theory (MLT) for convective mixing with mixing-length parameters of αMLT = 1.6 and 1.74, respectively, for Geneva and Parsec, and both using the Schwarzschild criterion to determine convective boundaries. For the convective core overshoot, Geneva uses step overshooting with an overshoot parameter of αov = 0.1, while PARSEC uses the overshoot formalism of Bressan et al. (1981), which would correspond to a step overshooting parameter of 0.25.
The metallicity of SU Cyg is ∼0 dex (Andrievsky et al. 2013), which is converted to Z ∼ 0.014 for both models. We also compared models with metallicities either side of this value, of namely 0.01 and 0.017. Figure 9 shows tracks for a stellar mass of 4.8 M⊙, both without rotation and with a moderate rotation (Ω/Ωcrit = 0.3), to see any possible impact of additional mixing due to rotation. We see that at the expected metallicity of 0.014, the two models are inconsistent, regardless of whether or not they include rotation effects. Models predict a higher mass than expected, as already reported in our previous works (see e.g. Evans et al. 2018a). PARSEC models predict a mass of between 5.1 M⊙ and 5.6 M⊙, while Geneva tracks predict 5.4 − 6.0 M⊙, > 0.3 M⊙ with our measurement. The only agreement would be with the PARSEC models, both with and without rotation, with a metallicity of Z = 0.01 (see upper right panel of Fig. 9). However, this would imply Fe/H ∼ −0.18 dex, which is in significant disagreement with the measured value.
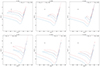 |
Fig. 9. Comparison of PARSEC (top three panels) and Geneva (bottom three panels) stellar evolutionary tracks for three metallicities encompassing SU Cyg metallicity, with (dotted lines) and without rotation for a 4.8 M⊙ stellar mass. The black dot represent the measured value, while the red and blue squares denote the predicted positions for the corresponding track. |
To check if the discrepancy could come from our measured mass, we added 5% error to our astrometric measurements and normalised all RVs to 1 km s−1. The MCMC analysis gave a similar Cepheid mass, of namely 4.83 ± 0.17 M⊙, although with a larger uncertainty, giving us confidence in the robustness of our measurement.
The mass of SU Cyg can be compared with other well-determined masses for the MW Cepheids, V1334 Cyg (Gallenne et al. 2018) and Polaris (Evans et al. 2024b), and also Cepheids in the LMC (Pilecki et al. 2018). Figure 10 shows these masses in comparison with predictions from evolutionary tracks from Bono et al. (2016) and Anderson et al. (2014). The Bono tracks cover MW and LMC metallicities (for the MW, we used the relations with no main sequence convective core overshoot and with moderate overshoot). The main sequence rotation and moderate convective overshoot are shown for the Anderson relation (Eq. (5) with solar metallicity). Average relations from Anderson et al. (2016, with and without rotation) corresponding to LMC metallicity are also displayed. The MW Cepheids are consistently brighter than the predictions, as are the LMC Cepheids with respect to models without rotation, except for one on the first instability crossing (LMC 1812), and a system that has possibly had a binary interaction (LMC 1718 A and B). The other LMC Cepheids are in better agreement with models including rotation.
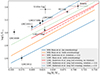 |
Fig. 10. Cepheid mass–luminosity relation. The MW Cepheids are plotted as filled circles, while LMC Cepheids are plotted as squares. Predictions from evolutionary tracks are overplotted. |
The mass for each companion can also be determined if we make the reasonable assumption that their orbital inclination is identical to their orbit around the Cepheid. We previously determined the mass function fB of the companion pair (see Table 3), which combined with the inclination and the total mass MB gives:

We determined masses for the secondary and tertiary components of MBa = 3.595 ± 0.033 M⊙ and MBb = 1.546 ± 0.009 M⊙, respectively. This would correspond to stars with spectral types of B8V and F1V, respectively. This is in good agreement with Evans & Bolton (1990), who suggested a B7.5V star from ultraviolet spectra for the secondary companion, and set an upper limit on the spectral type of the tertiary companion to be later than A0V.
5.3. The temperature of SU Cyg Ba
The temperature of the hottest star in the SU Cyg system can be determined by comparing the IUE spectrum SWP 14773 with the BOSZ Synthetic Stellar Spectral Library (Bohlin et al. 2017). This spectrum has been discussed before (Evans 1995), however the model comparisons provide a direct link between temperatures and the masses of detached eclipsing binaries (Evans et al. 2023). Details of the comparisons are provided in Evans et al. (2024a).
The first step in the temperature determination is to obtain the reddening E(B − V). As this was discussed by (Evans 1995) using colours corrected for the companion, we start with the E(B − V) = 0.109 from Trahin (2019). Using this, we de-reddened the IUE spectrum and ran it through a program that compares it with models of a series of temperatures. Details of the fitting are provided by the figures in Appendix A.
The best-fit temperature is 13 500 ± 920 K according to the parabola fit to the standard deviations of the spectrum-model differences (Fig. A.3). As in the discussion of the detached eclipsing binaries (DEBs), the uncertainty was also estimated visually from the spectral differences (Fig. A.2), which provides a value of 500 K. This corresponds approximately to a B7.3V star in the calibration of Pecaut & Mamajek (2013), which is in good agreement with our estimate from the previous section. To estimate its mass, we can use the formula relating temperature and mass derived from DEBs by Evans et al. (2023). As is the case for the FN Vel system (Evans et al. 2024a), because SU Cyg Ba is the companion of a massive young Cepheid, it is at the younger (hotter) half of the relation. Thus, the mass is decreased by 0.02 in log M. Also, SU Cyg Ba is a HgMn star, and the DEB study of Evans et al. (2023) provides some information about those. In the sample of DEBs, there are five Am (metallic lined) stars. These sit above (at larger masses than) normal stars. Although they are all cooler than SU Cyg Ba, this is an indication that chemically peculiar stars have cooler temperatures than normal stars. If we make an approximate correction of 0.02 in log T for this, the mass of Ba becomes 3.75 M⊙, and the mass of Bb is 1.37 M⊙. These are similar to our previous determination of Sect. 5.2.
6. Conclusion
We report new interferometric and ultraviolet spectroscopic observations of the binary Cepheid SU Cygni. Our measurements enabled us to detect the astrometric motion of the centre of light of the binary companion and to measure their RVs. Combining with RVs from the literature for the Cepheid, we were able to measure the mass of the Cepheid with a precision of 1.2% and its distance with a precision of 0.5%. Predictions from evolutionary models do not agree with the current luminosity or mass of the Cepheid, providing larger values than expected. We already reported these discrepancies in our previous works for the Cepheid V1334 Cyg and Polaris. Accounting for rotation or core overshooting does not solve this issue.
This work also provides the most precise distance for a Cepheid. We find a slight disagreement with Gaia at the level of 1.5σ, which is acceptable, as SU Cyg is very bright and likely saturates the camera. We used our measurement to estimate the absolute magnitude of the star, which we compared with predictions from a few P-L relations calibrated with photometry or parallax measurements. We find that the photometry-calibrated P-L relations are in disagreement with our measurement, while the parallax-calibrated relations are in better agreement.
SU Cyg is the best Cepheid in our sample, as it provides the most precise mass and distance estimate. With our similar previous work on V1334 Cyg and Polaris, we now have a few Cepheids with precise dynamical mass measurements, which can be used to calibrate stellar evolution models. Finally, V1334 Cyg and SU Cyg are bright targets and are pulsating stars, and therefore they can serve as benchmark stars for the bright-star mode of Gaia and can be used to test saturation effect corrections and to check for systematic errors related to colour variation effects.
Available at https://github.com/amerand/CANDID and https://github.com/agallenne/GUIcandid for a GUI version.
With the Python package emcee developed by Foreman-Mackey et al. (2013)
Acknowledgments
This work is based upon observations obtained with the Georgia State University Center for High Angular Resolution Astronomy Array at Mount Wilson Observatory. The CHARA Array is supported by the National Science Foundation under Grant No. AST-1636624 and AST-2034336. Institutional support has been provided from the GSU College of Arts and Sciences and the GSU Office of the Vice President for Research and Economic Development. Time at the CHARA Array was granted through the NOIRLab community access program (NOAO ProgID 2019A-N0071-PI and NOIRLab PropID 2023B-381062; PI: A. Gallenne). AG acknowledges the support of the Agencia Nacional de Investigación Científica y Desarrollo (ANID) through the FONDECYT Regular grant 1241073 and ANID-ALMA fund No. ASTRO20-0059. PK, GP and WG acknowledge funding from the European Research Council (ERC) under the European Union’s Horizon 2020 research and innovation program (project UniverScale, grant agreement 951549). JDM acknowledges funding for the development of MIRC-X (NASA-XRP NNX16AD43G, NSF-AST 1909165). Support was provided by HST-GO-16208.001-A for CP and JK. Support for EMW was provided from HST-GO-14194.001-A. Support was provided by HST-GO-13841 for JDM and CP. SK acknowledges funding for MIRC-X received funding from the European Research Council (ERC) under the European Union’s Horizon 2020 research and innovation programme (Starting Grant No. 639889 and Consolidated Grant No. 101003096). GP acknowledges financial support from the Polish Ministry of Science and Higher Education with the grant agreement 2024/WK/02. GP and PK acknowledge support from the Polish-French Marie Skłodowska-Curie and Pierre Curie Science Prize awarded by the Foundation for Polish Science. B.P. acknowledges funding from the Polish National Science Center grant SONATA BIS 2020/38/E/ST9/00486. This work has made use of data from the European Space Agency (ESA) mission Gaia (https://www.cosmos.esa.int/gaia), processed by the Gaia Data Processing and Analysis Consortium (DPAC, https://www.cosmos.esa.int/web/gaia/dpac/consortium). Funding for the DPAC has been provided by national institutions, in particular the institutions participating in the Gaia Multilateral Agreement. This research made use of services provided by the Jean-Marie Mariotti Center (Aspro and SearchCal). The SIMBAD database, and NASA’s Astrophysics Data System Bibliographic Services were used in the preparation of this paper.
References
- Alcock, C., Allsman, R. A., Axelrod, T. S., et al. 1995, AJ, 109, 1653 [NASA ADS] [CrossRef] [Google Scholar]
- Anderson, R. I., Ekström, S., Georgy, C., et al. 2014, A&A, 564, A100 [NASA ADS] [CrossRef] [EDP Sciences] [Google Scholar]
- Anderson, R. I., Saio, H., Ekström, S., Georgy, C., & Meynet, G. 2016, A&A, 591, A8 [NASA ADS] [CrossRef] [EDP Sciences] [Google Scholar]
- Andrievsky, S. M., Lépine, J. R. D., Korotin, S. A., et al. 2013, MNRAS, 428, 3252 [NASA ADS] [CrossRef] [Google Scholar]
- Anugu, N., Le Bouquin, J.-B., Monnier, J. D., et al. 2020, AJ, 160, 158 [NASA ADS] [CrossRef] [Google Scholar]
- Baade, W. 1926, Astron. Nachr., 228, 359 [NASA ADS] [CrossRef] [Google Scholar]
- Baer, M., Proffitt, C. R., & Lockwood, S. A. 2018, A Python Script for Aligning the STIS Echelle Blaze Function, Instrument Science Report STIS 2018-1, 13 [Google Scholar]
- Barnes, T. G. I., Moffett, T. J., & Slovak, M. H. 1987, ApJS, 65, 307 [NASA ADS] [CrossRef] [Google Scholar]
- Benedict, G. F., McArthur, B. E., Feast, M. W., et al. 2007, AJ, 133, 1810 [NASA ADS] [CrossRef] [Google Scholar]
- Berdnikov, L. N. 2008, VizieR Online Data Catalog: II/285 [Google Scholar]
- Boffin, H. M. J., Hillen, M., Berger, J. P., et al. 2014, A&A, 564, A1 [NASA ADS] [CrossRef] [EDP Sciences] [Google Scholar]
- Bohlin, R. C., Mészáros, S., Fleming, S. W., et al. 2017, AJ, 153, 234 [Google Scholar]
- Bono, G., Caputo, F., & Castellani, V. 2006, Mem. Soc. Astron. It., 77, 207 [NASA ADS] [Google Scholar]
- Bono, G., Braga, V. F., Pietrinferni, A., et al. 2016, Mem. Soc. Astron. It., 87, 358 [NASA ADS] [Google Scholar]
- Borgniet, S., Kervella, P., Nardetto, N., et al. 2019, A&A, 631, A37 [NASA ADS] [CrossRef] [EDP Sciences] [Google Scholar]
- Bressan, A. G., Chiosi, C., & Bertelli, G. 1981, A&A, 102, 25 [Google Scholar]
- Bressan, A., Marigo, P., Girardi, L., et al. 2012, MNRAS, 427, 127 [NASA ADS] [CrossRef] [Google Scholar]
- Breuval, L., Kervella, P., Anderson, R. I., et al. 2020, A&A, 643, A115 [EDP Sciences] [Google Scholar]
- Chelli, A., Duvert, G., Bourgès, L., et al. 2016, A&A, 589, A112 [NASA ADS] [CrossRef] [EDP Sciences] [Google Scholar]
- Clementini, G., Ripepi, V., Molinaro, R., et al. 2019, A&A, 622, A60 [NASA ADS] [CrossRef] [EDP Sciences] [Google Scholar]
- Costa, G., Girardi, L., Bressan, A., et al. 2019, MNRAS, 485, 4641 [NASA ADS] [CrossRef] [Google Scholar]
- Czesla, S., Schröter, S., Schneider, C. P., et al. 2019, PyA: Python astronomy-related packages, Astrophysics Source Code Library [record ascl:1906.010] [Google Scholar]
- Evans, N. R. 1988, ApJS, 66, 343 [NASA ADS] [CrossRef] [Google Scholar]
- Evans, N. R. 1989, AJ, 97, 1737 [NASA ADS] [CrossRef] [Google Scholar]
- Evans, N. R. 1995, ApJ, 445, 393 [NASA ADS] [CrossRef] [Google Scholar]
- Evans, N. R., & Bolton, C. T. 1990, ApJ, 356, 630 [NASA ADS] [CrossRef] [Google Scholar]
- Evans, N. R., Karovska, M., Bond, H. E., et al. 2018a, ApJ, 863, 187 [Google Scholar]
- Evans, N. R., Proffitt, C., Carpenter, K. G., et al. 2018b, ApJ, 866, 30 [NASA ADS] [CrossRef] [Google Scholar]
- Evans, N. R., Ferrari, M. G., Kuraszkiewicz, J., et al. 2023, AJ, 166, 109 [NASA ADS] [CrossRef] [Google Scholar]
- Evans, N. R., Kervella, P., Kuraszkiewicz, J., et al. 2024a, AJ, 168, 221 [NASA ADS] [CrossRef] [Google Scholar]
- Evans, N. R., Schaefer, G. H., Gallenne, A., et al. 2024b, ApJ, 971, 190 [NASA ADS] [CrossRef] [Google Scholar]
- Feast, M. W., & Catchpole, R. M. 1997, MNRAS, 286, L1 [NASA ADS] [CrossRef] [Google Scholar]
- Fernie, J. D. 1990, ApJS, 72, 153 [NASA ADS] [CrossRef] [Google Scholar]
- Foreman-Mackey, D., Hogg, D. W., Lang, D., & Goodman, J. 2013, PASP, 125, 306 [Google Scholar]
- Fouqué, P., Arriagada, P., Storm, J., et al. 2007, A&A, 476, 73 [NASA ADS] [CrossRef] [EDP Sciences] [Google Scholar]
- Freedman, W. L. 2021, ApJ, 919, 16 [NASA ADS] [CrossRef] [Google Scholar]
- Gallenne, A., Kervella, P., & Mérand, A. 2012, A&A, 538, A24 [NASA ADS] [CrossRef] [EDP Sciences] [Google Scholar]
- Gallenne, A., Mérand, A., Kervella, P., et al. 2013, A&A, 558, A140 [NASA ADS] [CrossRef] [EDP Sciences] [Google Scholar]
- Gallenne, A., Mérand, A., Kervella, P., et al. 2015, A&A, 579, A68 [NASA ADS] [CrossRef] [EDP Sciences] [Google Scholar]
- Gallenne, A., Kervella, P., Mérand, A., et al. 2017, A&A, 608, A18 [NASA ADS] [CrossRef] [EDP Sciences] [Google Scholar]
- Gallenne, A., Kervella, P., Evans, N. R., et al. 2018, ApJ, 867, 121 [Google Scholar]
- Gallenne, A., Mérand, A., Kervella, P., et al. 2021, A&A, 651, A113 [NASA ADS] [CrossRef] [EDP Sciences] [Google Scholar]
- Groenewegen, M. A. T. 2013, A&A, 550, A70 [NASA ADS] [CrossRef] [EDP Sciences] [Google Scholar]
- Groenewegen, M. A. T. 2018, A&A, 619, A8 [NASA ADS] [CrossRef] [EDP Sciences] [Google Scholar]
- Halbwachs, J.-L., Pourbaix, D., Arenou, F., et al. 2023, A&A, 674, A9 [NASA ADS] [CrossRef] [EDP Sciences] [Google Scholar]
- Hellerich, J. 1919, Astron. Nachr., 210, 65 [Google Scholar]
- Hocdé, V., Nardetto, N., Borgniet, S., et al. 2020a, A&A, 641, A74 [EDP Sciences] [Google Scholar]
- Hocdé, V., Nardetto, N., Lagadec, E., et al. 2020b, A&A, 633, A47 [NASA ADS] [CrossRef] [EDP Sciences] [Google Scholar]
- Hocdé, V., Nardetto, N., Matter, A., et al. 2021, A&A, 651, A92 [NASA ADS] [CrossRef] [EDP Sciences] [Google Scholar]
- Imbert, M. 1984, A&AS, 58, 529 [NASA ADS] [Google Scholar]
- Irwin, J. B. 1952, ApJ, 116, 211 [Google Scholar]
- Irwin, J. B. 1959, AJ, 64, 149 [Google Scholar]
- Keller, S. C. 2008, ApJ, 677, 483 [NASA ADS] [CrossRef] [Google Scholar]
- Kervella, P., Mérand, A., Perrin, G., & Coudé Du Foresto, V. 2006, A&A, 448, 623 [NASA ADS] [CrossRef] [EDP Sciences] [Google Scholar]
- Kiss, L. L. 1998, MNRAS, 297, 825 [NASA ADS] [CrossRef] [Google Scholar]
- Konacki, M., Muterspaugh, M. W., Kulkarni, S. R., & Hełminiak, K. G. 2010, ApJ, 719, 1293 [NASA ADS] [CrossRef] [Google Scholar]
- Kovtyukh, V., Lemasle, B., Chekhonadskikh, F., et al. 2016, MNRAS, 460, 2077 [Google Scholar]
- Lindegren, L., Bastian, U., Biermann, M., et al. 2021, A&A, 649, A4 [EDP Sciences] [Google Scholar]
- Luck, R. E. 2018, AJ, 156, 171 [Google Scholar]
- Mayor, M., Imbert, M., Andersen, J., et al. 1983, A&AS, 54, 495 [NASA ADS] [Google Scholar]
- Mérand, A., Kervella, P., Coudé Du Foresto, V., et al. 2006, A&A, 453, 155 [CrossRef] [EDP Sciences] [Google Scholar]
- Mérand, A., Kervella, P., Breitfelder, J., et al. 2015, A&A, 584, A80 [NASA ADS] [CrossRef] [EDP Sciences] [Google Scholar]
- Moffett, T. J., & Barnes, T. G., III 1984, ApJS, 55, 389 [NASA ADS] [CrossRef] [Google Scholar]
- Monnier, J. D., Berger, J.-P., Millan-Gabet, R., & ten Brummelaar, T. A. 2004, SPIE Conf. Ser., 5491, 1370 [NASA ADS] [Google Scholar]
- Monnier, J. D., Zhao, M., Pedretti, E., et al. 2007, Science, 317, 342 [NASA ADS] [CrossRef] [Google Scholar]
- Monnier, J. D., Le Bouquin, J.-B., Anugu, N., et al. 2018, SPIE Conf. Ser., 10701, 1070122 [NASA ADS] [Google Scholar]
- Monson, A. J., & Pierce, M. J. 2011, ApJS, 193, 12 [Google Scholar]
- Neilson, H. R., Cantiello, M., & Langer, N. 2011, A&A, 529, L9 [NASA ADS] [CrossRef] [EDP Sciences] [Google Scholar]
- Nguyen, C. T., Costa, G., Girardi, L., et al. 2022, A&A, 665, A126 [NASA ADS] [CrossRef] [EDP Sciences] [Google Scholar]
- Pecaut, M. J., & Mamajek, E. E. 2013, ApJS, 208, 9 [Google Scholar]
- Pilecki, B. 2024, ApJ, 970, L14 [NASA ADS] [CrossRef] [Google Scholar]
- Pilecki, B., Gieren, W., Pietrzyński, G., et al. 2018, ApJ, 862, 43 [NASA ADS] [CrossRef] [Google Scholar]
- Pilecki, B., Pietrzyński, G., Anderson, R. I., et al. 2021, ApJ, 910, 118 [NASA ADS] [CrossRef] [Google Scholar]
- Pilecki, B., Thompson, I. B., Espinoza-Arancibia, F., et al. 2024, A&A, 686, A263 [NASA ADS] [CrossRef] [EDP Sciences] [Google Scholar]
- Proffitt, C. R., Evans, N. R., Winston, E. M., Gallenne, A., & Kervella, P. 2017, Eur. Phys. J. Web Conf., 152, 04003 [Google Scholar]
- Sandage, A., Tammann, G. A., & Reindl, B. 2004, A&A, 424, 43 [NASA ADS] [CrossRef] [EDP Sciences] [Google Scholar]
- Setterholm, B. R., Monnier, J. D., Le Bouquin, J.-B., et al. 2023, J. Astron. Telesc. Instrum. Syst., 9, 025006 [NASA ADS] [CrossRef] [Google Scholar]
- Storm, J., Gieren, W., Fouqué, P., et al. 2011, A&A, 534, A94 [CrossRef] [EDP Sciences] [Google Scholar]
- Szabados, L. 1977, Commun. Konkoly Obs. Hungary, 70, 1 [Google Scholar]
- Szilàdi, K., Vinkò, J., & Szabados, L. 2018, Acta Astron., 68, 111 [Google Scholar]
- ten Brummelaar, T. A., McAlister, H. A., Ridgway, S. T., et al. 2005, ApJ, 628, 453 [Google Scholar]
- Trahin, B. 2019, Ph.D. Thesis, Université PSL, https://hal.archives-ouvertes.fr/tel-02372923 [Google Scholar]
- Trahin, B., Breuval, L., Kervella, P., et al. 2021, A&A, 656, A102 [NASA ADS] [CrossRef] [EDP Sciences] [Google Scholar]
- Wahlgren, G. M., & Evans, N. R. 1998, A&A, 332, L33 [NASA ADS] [Google Scholar]
- Wesselink, A. J. 1946, Bull. Astron. Inst. Netherlands, 10, 91 [Google Scholar]
- Wilson, T. D., Carter, M. W., Barnes, Thomas G. I., van Citters, G. Wayne, J., & Moffett, T., 1989, J., ApJS, 69, 951 [NASA ADS] [Google Scholar]
- Wright, J. T., & Howard, A. W. 2009, ApJS, 182, 205 [Google Scholar]
- Zucker, S., & Alexander, T. 2007, ApJ, 654, L83 [NASA ADS] [CrossRef] [Google Scholar]
Appendix A: Comparison of SU Cyg Ba spectrum with models
The spectrum of SU Cyg Ba is provided in IUE spectrum SWP 14773. In the wavelength region 1150 − 1900 Å the Cepheid SU Cyg A contributes negligible flux, as does the less massive cooler companion SU Cyg Bb. The spectrum is de-reddened by E(B − V) = 0.109 mag, and also corrected to the HST STIS flux scale. The spectrum is compared with BOSZ atmospheres in a series of temperatures, as shown in Fig. A.1. The differences between the spectrum and the models is shown Fig. A.2. The standard deviations from Fig. A.2 are shown in Fig. A.3 as a function of the model temperature. The temperature found from the parabola in Fig. A.3 is 13500 ± 920 K
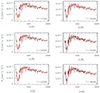 |
Fig. A.1. Comparison between BOSZ models and the STIS spectrum de-reddened for E(B − V) = 0.109 mag. Models are in red and spectrum in black. The temperature for the models is listed within each plot. |
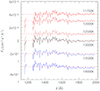 |
Fig. A.2. Difference between the model and the spectrum for E(B − V) = 0.109 mag. The temperatures for the models is written on each plot. The wavelengths between 1180 − 1250 Å are omitted because of contamination by interstellar Lyα absorption. |
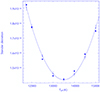 |
Fig. A.3. Standard deviations from the spectrum-model comparison as the temperature of the models is changed. Dots show the standard deviation, and triangles the parabola fit. |
From the absolute magnitude difference between SU Cyg A and B and the colour of Ba, the contribution to the combined magnitude from the companion is found to be 0.08 mag. The E(B − V) is also recomputed from corrected colours using the appropriate formula from Fernie (1990). The small change in E(B − V) resulted in a negligible change in the temperature of the companion Ba.
All Tables
Best-fit parameters of the STIS differential velocities of the long- and short-period orbit.
All Figures
|
Fig. 1. Velocities in the wavelength segments for the STIS observations. The observation number from Table 2 is on the left. Velocities are determined by cross-correlation with the first observation, which is shown as the line at ΔVr = 0. The average velocity for each observation is shown as a dashed line. |
| In the text | |
|
Fig. 2. Fit of the long and short orbital period of the STIS radial velocities. |
| In the text | |
|
Fig. 3. Fit of the orbital and pulsation motion of the Cepheid using data from Imbert (1984) (top panels) and Evans (1989) (bottom panels). The fitted model is represented with a black line and the observations are shown as blue dots. |
| In the text | |
|
Fig. 4. Result of our combined fit. Left: Fitted (solid lines) and measured primary (blue dots) and secondary (red dots) orbital velocity. Middle: Fitted (solid line) and extracted (blue dots) pulsation velocity. Right: Relative astrometric orbit of the companion pair. |
| In the text | |
|
Fig. 5. Corner plots of the Markov chain Monte Carlo posterior distributions produced from emcee for the long period orbit. |
| In the text | |
|
Fig. 6. Orbits of SU Cyg A (blue) and its companion B (red) around their common centre of mass. The average virtual orbit of the photocentre of the system is shown as a dashed black ellipse. The grey ellipses represent the maximum and minimum shifts in the photocentre relative to the average position, which are caused by the brightness variations of the Cepheid during its pulsation cycle. |
| In the text | |
|
Fig. 7. Comparison between the absolute magnitudes of SU Cyg predicted from P-L relations in the literature (black dots) and the present distance measurement (blue areas), in two photometric bands. The blue areas represent the measured absolute magnitude after correcting for the flux contamination from the companion. The green triangles represent the absolute magnitudes determined from P-L relations from the literature using a fundamentalised pulsation period, with the downwards- and upwards-pointing triangles showing that for the longest (5.757 d) and shortest (5.455 d) converted periods. We see that only modern-era P-L calibrations (including Gaia) seem to correctly predict the luminosity of SU Cyg. |
| In the text | |
|
Fig. 8. Fitted V-band light curve of SU Cyg. |
| In the text | |
|
Fig. 9. Comparison of PARSEC (top three panels) and Geneva (bottom three panels) stellar evolutionary tracks for three metallicities encompassing SU Cyg metallicity, with (dotted lines) and without rotation for a 4.8 M⊙ stellar mass. The black dot represent the measured value, while the red and blue squares denote the predicted positions for the corresponding track. |
| In the text | |
|
Fig. 10. Cepheid mass–luminosity relation. The MW Cepheids are plotted as filled circles, while LMC Cepheids are plotted as squares. Predictions from evolutionary tracks are overplotted. |
| In the text | |
|
Fig. A.1. Comparison between BOSZ models and the STIS spectrum de-reddened for E(B − V) = 0.109 mag. Models are in red and spectrum in black. The temperature for the models is listed within each plot. |
| In the text | |
|
Fig. A.2. Difference between the model and the spectrum for E(B − V) = 0.109 mag. The temperatures for the models is written on each plot. The wavelengths between 1180 − 1250 Å are omitted because of contamination by interstellar Lyα absorption. |
| In the text | |
|
Fig. A.3. Standard deviations from the spectrum-model comparison as the temperature of the models is changed. Dots show the standard deviation, and triangles the parabola fit. |
| In the text | |
Current usage metrics show cumulative count of Article Views (full-text article views including HTML views, PDF and ePub downloads, according to the available data) and Abstracts Views on Vision4Press platform.
Data correspond to usage on the plateform after 2015. The current usage metrics is available 48-96 hours after online publication and is updated daily on week days.
Initial download of the metrics may take a while.