Open Access
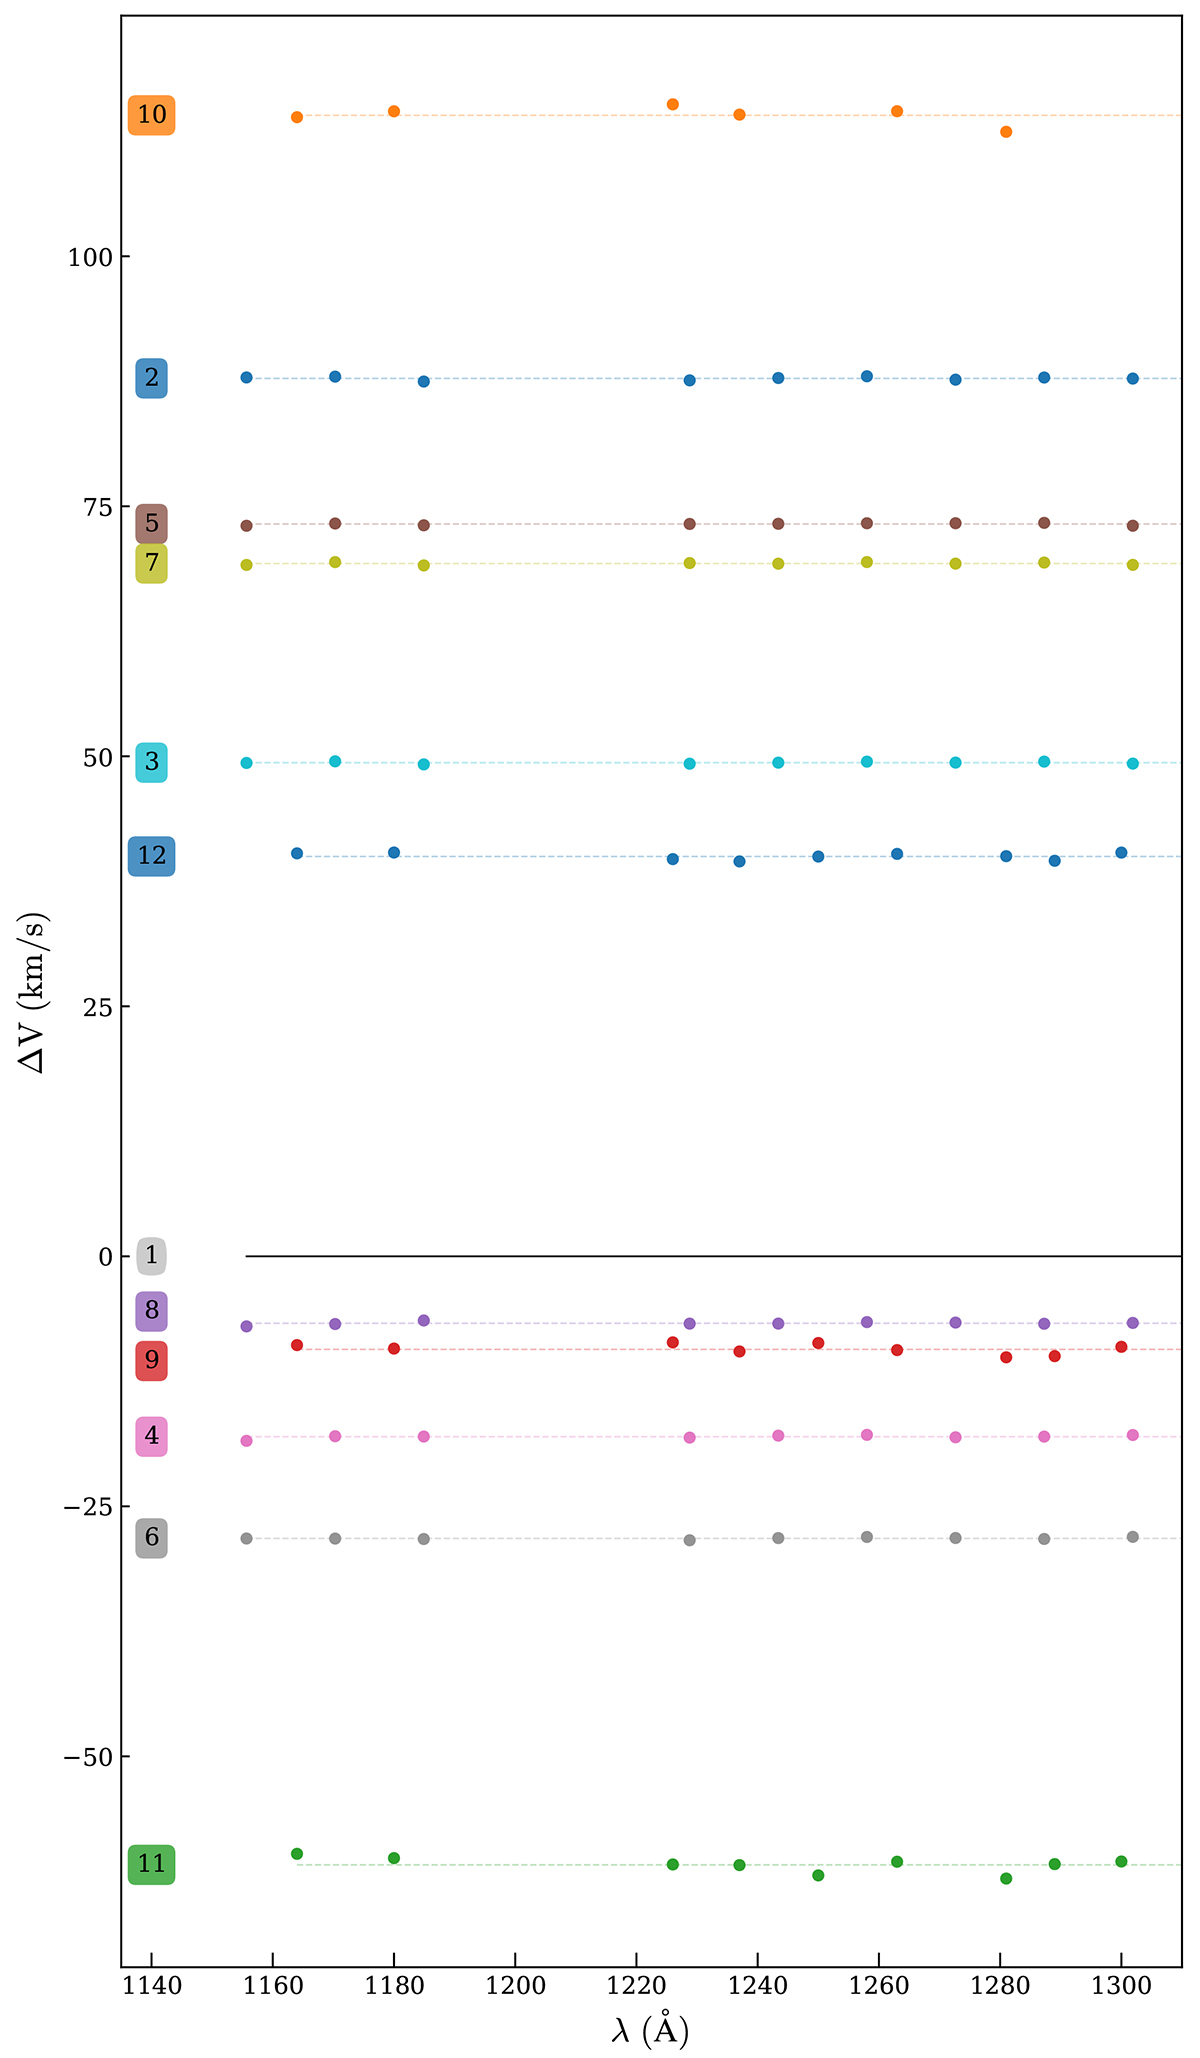
Fig. 1.
Download original image
Velocities in the wavelength segments for the STIS observations. The observation number from Table 2 is on the left. Velocities are determined by cross-correlation with the first observation, which is shown as the line at ΔVr = 0. The average velocity for each observation is shown as a dashed line.
Current usage metrics show cumulative count of Article Views (full-text article views including HTML views, PDF and ePub downloads, according to the available data) and Abstracts Views on Vision4Press platform.
Data correspond to usage on the plateform after 2015. The current usage metrics is available 48-96 hours after online publication and is updated daily on week days.
Initial download of the metrics may take a while.