| Issue |
A&A
Volume 693, January 2025
|
|
|---|---|---|
| Article Number | A138 | |
| Number of page(s) | 10 | |
| Section | Stellar structure and evolution | |
| DOI | https://doi.org/10.1051/0004-6361/202452338 | |
| Published online | 10 January 2025 | |
The physical mechanism for the formation of lithium-rich red clump stars: Rotation, thermohaline mixing, and internal gravity waves
1
College of Physics, Guizhou University, Guiyang, Guizhou Province 550025, PR China
2
Geneva Astronomical Observatory, Geneva University, Sauverny CH-1290, Switzerland
3
National Astronomical Observatories, Chinese Academy of Sciences, Beijing 100012, PR China
4
College of Physics, Henan Normal University, Xinxiang, Henan Province 453007, PR China
5
Department of Physics, Anhui Normal University, Wuhu 241000, PR China
⋆ Corresponding author; This email address is being protected from spambots. You need JavaScript enabled to view it.
, This email address is being protected from spambots. You need JavaScript enabled to view it.
Received:
22
September
2024
Accepted:
30
November
2024
Abstract
Context. About 0.2–2% of red clump stars are revealed as Lithium-rich stars and thus the surface abundance of lithium clearly increases in some red clump stars. The physical mechanism of the enrichment of lithium on the surface of these stars has not yet been explained satisfactorily by the evolutionary models of single stars.
Aims. Our aim is to investigate how rotation, thermohaline mixing, and internal gravity waves have an important impact on the surface chemical abundance of lithium-rich red giants.
Methods. The equations for angular momentum transport and the chemical element diffusion for rotating stars have been implemented in this paper. The diffusion coefficients of rotationally induced instabilities, thermohaline mixing, and internal gravitational waves have been included in the diffusion equation of chemical elements.
Results. Rotational mixing, thermohaline mixing, and internal gravity waves have been invoked to explain this feature. Rotation impacts the evolution of the surface abundance of Lithium, but it seems an unlikely explanation for a ubiquitous mixing event occurring between the tip of the red giant star and the red clump star. Thermohaline mixing can explain the observed behaviour of 12C/13C and 14N/12C and lithium in low-mass stars that are more luminous than the red-giant branch bump, and its efficiency is decreasing with the increasing initial stellar mass.
Conclusions. The internal gravity wave- (IGW-) induced mixing is located between the hydrogen-burning shell, and the outer convective envelope, and it is mainly triggered by turbulent convective motion. This physical process is beneficial to transfer the large amount of 7Be to the cool envelope where it is converted to 7Li. Therefore, IGW-induced mixing could play a main role in explaining the red clump star with lithium enrichment. Rotation can indirectly increase the above effect by making the core-helium-burning lifetime longer. Thermohaline mixing is much smaller than the one of IGWs during the evolution of red clump stars.
Key words: stars: abundances / stars: evolution / stars: interiors / stars: low-mass / stars: rotation / stars: solar-type
© The Authors 2025
 Open Access article, published by EDP Sciences, under the terms of the Creative Commons Attribution License (https://creativecommons.org/licenses/by/4.0), which permits unrestricted use, distribution, and reproduction in any medium, provided the original work is properly cited.
This article is published in open access under the Subscribe to Open model. This email address is being protected from spambots. You need JavaScript enabled to view it. to support open access publication.
1. Introduction
Lithium is one of the four stable species produced in significant amounts during Big Bang nucleosynthesis. However, the observed value of the lithium abundance in many kinds of objects is not consistent with theoretical predictions (Spite & Spite 1982; Tajitsu et al. 2015). For example, Spite & Spite (1982) found that the lithium abundance in metal-poor halo stars in the Milky Way show a constant value around ALi = 2.1 dex (ALi = log10(NLi/NH)+12) when plotted as a function of [Fe/H] (for [Fe/H] below about −2), which is significantly lower than that predicted by Big Bang nucleosynthesis. About half of the lithium in the interstellar medium can be generated by Big Bang nucleosynthesis and cosmic ray spallation of interstellar atoms; however, the origin of the other half is still debated. Tajitsu et al. (2015) have claimed that novae are one of the important contributing sources of interstellar lithium elements, but other sources of Li are needed.
When the temperature is above 2.5 × 10⁶ K, 7Li is destroyed by proton capture via the nuclear reaction 7Li(p, 4He)4He. Therefore, lithium only survives in the cold outer envelope of a star. Convection in these outer layers may bring down the lithium in deeper layers of the stars hot enough to activate proton capture reactions. Therefore, a star with an initial abundance similar to the interstellar medium lithium abundance (A(Li) ∼ 3.4 dex, Asplund et al. (2009)) generally has no more than 1.5 dex (Palmerini et al. 2011) when it evolves into the red giant stage. There are exceptions: about 150 Li-rich giants1 show A(Li) ≥ 1.5 dex, and some among them are super-Li rich with ALi ≥ 3.4 dex (Kumar et al. 2011; Adamów et al. 2014) or even A(Li) ≥ 4.5 dex (Yan et al. 2018). Casey et al. (2019) have reported the discovery of 2,330 lithium-rich giant stars.
Rotation has been proposed as an important physical factor that can trigger the mixing in red-giant branch (RGB) stars by several authors (Sweigart & Mengel 1979; Charbonnel 1995). Rotation adds a centrifugal force against gravity and triggers various instabilities inside stars. It triggers Egddington-Sweet, Goldreich-Schubert-Fricke (GSF), secular shear, dynamical shear, and Solberg-Hoiland instabilities (Goldreich & Schubert 1967; Langer 2012). These instabilities can transport both angular momentum and chemical species inside stars. The rotational mixing can transfer freshly synthesised elements inside stars towards the surface, and the corresponding surface chemical species goes up.
Thermohaline mixing is induced by the 3He(3He, 2p)4He reaction that creates an inversion of mean molecular weight. It has been proposed to be the most likely process modifying the photospheric compositions of bright low-mass red giant stars (Charbonnel & Zahn 2007; Eggleton 2006).
Different scenarios have been proposed in the literature to explain the Li-rich red giants. Kumar also used the Galactic Archaeology with HERMES second public data release 2 (GALAH DR2) and Gaia Data Release 2 (Gaia DR2) (Gaia Collaboration 2018) to confirm that the Li abundance of red clump (RC) stars is 40 times higher than those at the tip of the red-giant branch (TRGB) (Kumar et al. 2020; Buder et al. 2018). It could be that this abnormality of Li abundance is due to a complex interaction between the TRGB and RC phases. The most significant event between these two stages is the occurrence of a He flash, especially the first, strongest He subflash (Gao et al. 2022; Yan et al. 2021). Casey et al. (2019) argue that a combination of tidal interactions, and possibly planetary engulfment, are the most plausible mechanisms that are consistent with the data. However, because a giant star increases in radius as it ascends the giant branch, planetary engulfment can only explain up to about 20 percent of lithium-rich giants. They conclude that tidal interactions seem to be the most dominant and plausible remaining explanation for lithium-rich giant stars. They have shown that tidal interactions in binary systems can be strong enough to drive internal mixing high enough such that lithium can be produced through the Cameron-Fowler mechanism. This effect is largest in a binary system where a giant star contracts in radius at the start of the core-helium-burning phase. A prediction of the hypothesis is that nearly every lithium-rich giant star with a helium-burning core has a binary companion.
The results by Zhang et al. (2020) strongly support the proposal that the merger of a helium white dwarf with an RGB star can provide the progenitors of lithium-rich RC stars. Lithium can also be generated in the interior of stars and very rapidly transferred to the surface by an extra mixing mechanism (Yan et al. 2018; Charbonnel & Balachandran 2000). The fresh lithium may be generated by the Cameron-Fowler mechanism, in which first 7Be is produced by 3He(α, γ)7Be, and then 7Be is transferred from the hydrogen-burning shell to a cooler region where it may be changed into lithium by β-capture 7Be(e−, ν)7Li. In this scenario, the actual physical mechanism that triggers the mixing plays a key role. Several extra mixing mechanisms have been proposed, including helium-flash-induced mixing (Schwab 2020), the mixing induced by the internal gravity waves (Li et al. 2023), and the merger of a helium-core white dwarf with a RGB star (Zhang et al. 2020).
Internal gravity waves are born at the interface between the radiative and the outer convective envelope. They propagate inward towards the core and are reflected at a point where the mass fraction of hydrogen drops rapidly. Thus, a resonance cavity is formed. Standing waves are also formed within it, which lead to a strong mixing process. The resonant cavity region of internal gravity waves might be the mixing region needed for the Cameron-Fowler mechanism to produce Li-rich giants.
Montalban (1994), Montalban & Schatzman (1996), and Montalbán & Schatzman (2000) have studied the impact on Li and Be abundances of this internal gravity wave mixing. They focused on solar-like main sequence (MS) stars. Denissenkov et al. (2024) propose that RGB stars are enriched in Li by extra mixing occurring between the luminosity bump and the TRGB. They discuss five mechanisms for extra mixing. They conclude that azimuthal magneto-rotational instability is the most efficient in explaining the lithium enrichment in RGB stars. Schwab (2020) also propose that gravity waves may explain the Li-enriched RC stars.
In this paper, we want to explore the interaction between rotational mixing and the one induced by the internal gravity wave. We want to explore how varying the initial conditions (i.e. stellar mass and rotational velocities) impact the formation of lithium-rich RC stars; how the surface chemical abundance varies with these initial parameters; and how the internal gravity wave- (IGW-) induced mixing is important at the stage of core-helium burning.
2. Ingredients of the numerical models
The models presented in this investigation have been calculated with the Modules for Experiments in Stellar Astrophysics (MESA, release: version 10398; Paxton et al. (2011, 2013, 2015, 2018, 2019)). We adopted the Ledoux criterion to determine the boundaries of the convective region. The semi-convection parameter was set to be αsem = 0.1. The effects of rotation on the equation for the transport of angular momentum and the chemical elements have been accounted for according to the diffusion equation described by Endal & Sofia (1978). Models account for the following additional physical processes: chemical mixing and transport of angular momentum due to the Tayler-Spruit dynamo theory (Spruit 2002) is included as in Heger et al. (2005). Angular momentum transport driven by the azimuthal magneto-rotational instability has been included following Spada et al. (2016).
Stellar models at a metallicity Z = 0.02, and mass fraction of hydrogen equal to 0.7 with initial masses between 1.3 and 1.7 M⊙ in steps of 0.1 solar masses have been computed. We have chosen to focus on this mass and metallicity range to be in agreement with the properties of the red giants observed by Li et al. (2023), Gao et al. (2022), Deepak & Reddy (2019), and Magrini et al. (2021) (stellar masses between ∼0.8 and 1.8 M⊙, and, [Fe/H] between −0.5 to 0.25 dex with peaks around 1.2 M⊙ and −0.05 dex, respectively).
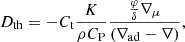
Initial rotational velocities between vini = 0 km/s to 150 km/s for the 1.3 M⊙ have been considered. In the MESA code, the initial A(Li) varies with initial Z (A(Li) = 3.4 + [Fe/H]), and the corresponding initial A(Li) is ∼3.4 dex at solar metallicity (Z = 0.02, [Fe/H] = 0). We needed to start from the pre-MS to build the model, so we used the meteoritic value A(Li) ∼ 3.4 dex from Grevesse & Sauval (1998) as the initial Li abundance. In this paper, we have included thermohaline mixing in the diffusion equation because it leads to a steep decline in the surface Li abundance in upper RGB stars. Thermohaline mixing is treated as a diffusion scheme (Braun 1997; Wellstein et al. 2001). The corresponding diffusion coefficient is based on the work of Stern (1960), Ulrich (1972), and Kippenhahn et al. (1980). It follows
 (1)
(1)
where ρ is the density, the thermal conductivity  , and CP is the specific heat capacity. The parameter Ct is a efficiency parameter for the thermohaline mixing. The value of this parameter depends on the geometry of the fingers arising from the instability and is still a matter of debate (Ulrich 1972; Kippenhahn et al. 1980; Charbonnel & Zahn 2007; Denissenkov et al. 2008). We decided to use the parameter Ct = 100 in this series.
We have also included the mixing by IGWs following the approach of Montalban (1994) and Montalban & Schatzman (1996). An analytical prescription for the diffusion coefficient associated with IGW mixing was developed and implemented to interpret the Li and Be depletions in the Sun and other low-mass MS stars of different ages by Montalban (1994) andMontalbán & Schatzman (2000). To estimate the diffusivity from mixing by IGWs, we followed the approach of Montalban (1994) and Montalban & Schatzman (1996), who found
![Mathematical equation: $$ \begin{aligned} D_{\rm M}=\frac{A^{2}}{2\pi }\frac{3}{n+7}\frac{3}{n+5}\left[D_{\rm th}N\left(\frac{\rho _{\rm b}}{\rho }\right)\left(\frac{r_{\rm b}}{r}\right)^{6}\right]^{2}f^{-2n}V^{8n-3}l^{1-2n} \end{aligned} $$](/articles/aa/full_html/2025/01/aa52338-24/aa52338-24-eq3.gif) (2)
(2)
where A is a numerical factor. Furthermore, ρ, r, and N are the density, radius, and buoyancy frequency at each depth, respectively. In addition, V and l represent the velocity and scale of eddy, respectively. Those quantities with a subscript b represent the value of the corresponding quantity at the lower boundary of the convective envelope. The quantity f is expressed as
 (3)
(3)
A suitable range of the diffusion coefficient for Li enhancement is obtained and the scope of diffusion coefficient is about 108 − 1014 cm2 s−1.
We note that the internal gravity wave mixing scenario in our paper differs from Li et al. (2023) and Schwab (2020). The differences are listed as follows.
– Firstly, Schwab (2020) could not take the scale of eddy and the velocity of eddy as constant values of about 109 cm and 106 cm/s for different evolutionary phases. So we re-evaluated the scale of eddy and improved its calculation. We give a relationship between the eddy velocity and the characteristic horizontal eddy scale of
 (4)
(4)
where Ω is angular velocity of eddy. The quantity for λ is
 (5)
(5)
The velocity of eddy can be expressed as follows:
 (6)
(6)
– Secondly, Li et al. (2023) have shown that the IGW can only be applied in the region that meets the requirement of N2 ≫ ω2. Furthermore, the mass of the helium core is less than 0.30 M⊙. On avenge, RC stars are more Li-rich than RGB stars. This means that the strong Li enhancement might occur after the helium-core flash or at the RC phase. Therefore, we employed internal gravity waves generated by convective turbulence inside stars during the first He flash. Furthermore, the diffusion coefficient derived by Li et al. (2023) is different from ours. The parameter  was adopted in Li et al. (2023), whereas the parameter n = 1 has been used in this work according to Schwab (2020).
For wind mass loss, we adopted the prescription (with ηR = 0.5) of Reimers (1975) from the ZAMS up to central helium exhaustion. On the AGB, we used the mass-loss formula of Vassiliadis & Wood (1993):
 (7)
(7)
3. Results of numerical calculations
The evolutionary tracks on the HR diagram are shown in the top panel of Fig. 1 for a different mass, with and without rotation. The observational samples imply that the mass and [Fe/H] of these stars are mainly concentrated between ∼0.8 and 1.8 M⊙ and −0.5 to 0.25 dex, and the peaks are around 1.2 M⊙ and −0.05 dex, respectively. The effective temperatures’ range is about 4200–6900 K (Zhang et al. 2021). From Fig. 1, one can find that our theoretical results are consistent with the observations. The luminosity of non-rotating stars is less than the one of rotating ones at the evolution of the MS (cf., panel a in Fig. 1). The main reason is that the rotationally induced mixing can cause helium to diffuse from the core to the envelope and thus the opacity in the envelope can be reduced by the rotationally induced mixing. Moreover, rotational mixing brings fresh hydrogen fuel into the convective core. Panel b of Fig. 1 shows log Teff − log g in non-rotating and rotating models for selected masses at solar metallicity. Rotating stars behave as stars with higher masses throughout their evolution. The rotationally induced mixing can slightly extend the lifetime of the MS. For example, the lifetime of the MS is 4.17282 Gyr for 1.3 M⊙ with vini = 100 km/s, whereas it is 4.09729 Gyr for the counterpart without rotation.
 |
Fig. 1. Evolution tracks in the Hertzsprung–Russell diagram of the stars with a different initial mass and rotational velocities in panel (a). Each curve with different colours refers to a different mass. Panel (b) shows the evolutionary curves in the log Teff − log g diagram. Point A denotes the zero age main sequence and point B represents the turn-off point of the MS. Point C is the stage of the first dredge-up. Points D, E, and F are the beginning (i.e. the tip of red giant star), midpoint, and end of lithium enrichment. Point G is the local maximal luminosity next to an RC star and point H is the core-helium exhaustion. |
The phase of core-He burning can also be increased significantly by rotational mixing because the rotationally induced mixing brings fresh helium from the H-burning shell into the core. The phase of the core-helium burning is longer in the 1.3 M⊙ model with vini = 100 km/s than the one in the non-rotating case. As a consequence of rotational mixing, the 1.3 M⊙ model with vini = 100 km/s has a carbon-oxygen core mass that is about 2.1% more massive than the non-rotating counterpart at the core-helium exhaustion.
3.1. The profile of angular velocity
The evolution of angular velocity for the model with a stellar mass of 1.3 M⊙ and with different initial velocities is illustrated in the left panel in Fig. 2. We find that the innermost core with a mass of about 0.17 M⊙ is rotating at a rate that is about 1.584 times faster than the surface at the end of the core-H-burning phase. Azimuthal magneto-rotational instability has little effect on transporting angular momentum during the core-hydrogen-burning phase because the Taylor-spruit dynamo tends towards solid body rotation.
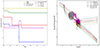 |
Fig. 2. Evolution of the angular velocity as a function of the distance to the center in a 1.3 M⊙ star. Left panel: evolution of angular velocity for the model 1.3 M⊙ with different initial velocities. Each curve with different colours refers to a different epoch. The epoch has been indicated in the legend. Evolution of the core and surface and core rotational rates as a function of the gravity for a 1.3 M⊙ star. Right panel: evolution of the core and surface rotation rates for models with different initial velocities. The grey triangles correspond to red giants in the lower RGB (Gehan et al. 2018). The magenta circles correspond to red giants presented by Mosser et al. (2012) with those grouped around log g ∼ 2.5 in the core-helium-burning phase. |
After the exhaustion of the central hydrogen, the stars undergo a phase of major adjustment as the core contracts and the envelope due to the mirror principle. The helium core spins up, whereas the angular velocity of the whole convective envelope substantially decreases according to the principle of angular momentum conservation. Angular momentum is removed rapidly from the core during this adjustment phase due to the azimuthal magneto-rotational instability. The efficiency of angular momentum transport by this instability heavily depends on the gradient of angular velocity at the interface between the core and the envelope.
At the RGB phase, the overall decrease in the rotation rate of the outer envelope is caused by two effects: strong mass loss via Reimers stellar winds from the surface, which carries away about 25% of the initial angular momentum, and the rapid expansion of the stellar envelope, which increases the total moment of inertia. For a lower-mass star of 1.3 M⊙, the angular velocity is mainly dominated by the great expansion of the envelope. At the same time, the stellar core contracts. Because of its small radial extent, the core contains only a small fraction of the total angular momentum.
We shall compare the predicted rotation rate of the theoretical models with the observations of asteroseismology data. The data of asteroseismology indicate that the core of the red giants in the observed sample are rotating 5–10 times faster than their envelopes (Moyano et al. 2023). The theoretical results reveal that the rotational ratio of the core to the envelope is about 6.31 at the red giant bump. The core rotation rate of the majority of RGB stars is in the range  nHz (Gehan et al. 2018). The theoretical results show that the core rotation rate of the RGB is about 1200 nHz. The angular velocities of the helium core in horizontal branch stars are of the order of 100 nHz from asteroseismic analysis. The theoretical results show that the core rotation rate of the horizontal branch is about 51 nHz. Angular momentum transport driven by the azimuthal magneto-rotational instability produces core rotation rates closer to observations. In total, the internal rotation rates obtained in the present models are in agreement with the asteroseismic constrains. This is particularly important to explain the enrichment mechanism of lithium-rich giants.
The right panel of Fig. 2 shows that the surface and central core rotation rates change with the the surface gravity. Our models with vini = 65, 100, and 150 km/s reproduce the core rotation rate of the red giants in the hydrogen-shell-burning phase (at log g ∼ 3.3 − 2.9) as well as their surface rotation rates. Once a star settles into the stable core-helium-burning phase, it spends 85% of its core-helium-burning time with core rotation rates  nHz, which is in agreement with asteroseismic constraints. Towards the end of the core-helium-burning phase, the core shifts to He- and H-shell burning and the subsequent CO core contracts while the envelope expands, leading to a spin-up of the core and a decrease in surface gravity, which occurs at log g ∼ 2.5 and
  .
.
3.2. Surface lithium enrichment in the MS and red giant stars
Fig. 3 shows the evolution of stellar luminosity as a function of the surface lithium abundance A(Li). The lithium abundance A(Li) stays constant during the MS for the non-rotating model (cf., the panel a of Fig. 3). When the non-rotating star 1.3 M⊙ reaches the turn-off point of the MS at log(L/L⊙)∼0.6, A(Li) starts to decrease from 3.4 to 0.8. This is an effect of the first dredge-up (Iben 1967, hereafter FDU). The magnitude of these changes depends on stellar mass, which determines the depth of the dredge-up.
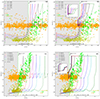 |
Fig. 3. Stellar luminosity as a function of the lithium abundance in stars for different models. Panel (a): stellar luminosity as a function of the lithium abundance in stars with different stellar mass without IGWs. Panel (b): stellar luminosity as a function of the lithium abundance in stars with different stellar mass with IGWs. Panel (c): stellar luminosity as a function of the lithium abundance in stars with a 1.3 M⊙ model in different initial rotational velocities without IGWs. Panel (d): stellar luminosity as a function of the lithium abundance in stars with different initial rotational velocities with IGWs. The yellow circles are RC stars and the green ones are red giant stars. They are from Kumar et al. (2020). |
The sudden drop in surface 7Li after the first dredge-up as shown in panel a is due to thermohaline mixing. The lithium depletion becomes faster from the RGB bump when the stellar mass become smaller because the efficiency of the thermohaline mixing increases with the decreasing stellar mass. Data from Gratton et al. (2000) suggest the lithium abundance A(Li) reduces about 0.9 dex due to the thermohaline mixing, whereas our theoretical results indicate that the lithium abundance A(Li) decreases about 0.8 dex for a 1.3 M⊙.
Rotation-induced mixing can modify the abundances’ profile in the stellar interiors already during the MS, enlarging the size of the lithium consumption region. As a consequence, compared to the non-rotational model, surface Lithium depletion starts earlier (i.e. at a higher effective temperature) (cf., panel c of Fig. 3). In rotating stars, however, rotationally induced mixing causes downward transport of lithium during the MS. This has one important consequence. The element lithium is transported into layers, where the temperature is sufficiently high to destroy it. This leads to a depletion of lithium by the rotating stars during the MS phase. The faster the rotational mixing in the envelope is, the stronger the depletion (cf., panel c in Fig. 3). The main reason is that the diffusion coefficient (and efficiency) due to meridional (Eddington-Sweet) circulation DES that characterises this mixing increases with the rotational rate. Therefore, lower Li abundances are predicted after the end of the MS (Palacios et al. 2003; Charbonnel et al. 2020). This process, therefore, results in a lower abundance of lithium after the first dredge-up.
The observational samples reveal that the range of red giant lithium abundance A(Li) is from −1 to 3.0, while the lithium abundance of the RC stars ranges from 0.516 to 4.7 (Zhang et al. 2021). The mass range of red giants is from 0.75 to 2.99 M⊙, while the mass of RC stars ranges from 0.6 to 2.57 M⊙. For observational samples, most of the RGB stars have only a lower limit of lithium abundance of about −1.0 dex. The Lithium abundance would be much smaller in the upper RGB compared to the one in the bottom of the RGB. Therefore, the observed lithium abundance decreases during the RGB. The observations in panel c of Fig. 3 show that a low initial rotation velocity (even non-rotating model) fits the RGB much better in this diagram. The models with initial rotation vini > 85 km/s do not match the majority of the stars from the bottom of the RGB onwards because rapid rotation is destroying too much Li.
3.3. Carbon isotope ratio and the ratio of nitrogen to carbon on the MS and red giant stars branch
The evolution of the surface abundances of selected isotopes is shown in Fig. 4. The observational data reveal that the metallicity in these samples of red giant stars and RC stars is −0.3 ≤ [Fe/H] ≤ 0.2. The mass range of these observational samples is from 1.3 M⊙ to 1.7 M⊙.
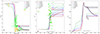 |
Fig. 4. Panel (a): carbon isotope ratios of 12C/13C as a function of the effective temperature for the 1.3 M⊙ solar metallicity stars with different initial rotational velocities. Panel (b): for the ratios of 14N/12C. Panel (c): for the 3He. The model with the thermohaline mixing (solid lines) and without the thermohaline mixing (dashed lines) are indicated in three panels. The observational samples are from these references (Tautvaišienė et al. 2010, 2013; Mikolaitis et al. 2012; de La Reza et al. 2003; McCormick et al. 2023). |
The 12C/13C ratio is the most robust diagnostic of deep mixing, because it is very sensitive to mixing processes and is almost insensitive to the adopted stellar parameters. Panel a in Fig. 4 illustrates that the carbon isotope ratio 12C/13C has dropped from the initial (solar) value of 82.2–24 at the end of the first dredge-up. Observational data imply that the ratio of 14N/12C increases from about ∼0.3 to ∼0.8 during the process of the first dredge-up (Tautvaišienė et al. 2010, 2013; de La Reza et al. 2003; Mikolaitis et al. 2012). Our theoretical results are consistent with the observations.
The surface abundance changes expected due to the FDU increase for the abundances of 3He, 4He, 13C, 14N, and 17O, and decrease (due to dilution) for the abundances of 1H, 2D, 12C, 7Li, 7Be, 8B, 16O, and 18O. Surface 3He and 7Li are anticorrelated because the pp-II branches fuse 3He with pre-existing 4He to form 7Be. Lithium can be produced via the nuclear reaction 7Be + e→7Li + νe + γ. The first dredge-up leaves behind an abundance discontinuity that becomes very important for subsequent evolution (Iben 1967). This discontinuity is believed to inhibit any extra mixing between the hydrogen-burning shell and the outer envelope (Chanamé et al. 2005).
Compared with the non-rotating model, one can find that surface abundances are already modified during the MS in the rotating models. We also find that rotation-induced mixing slightly reduces the post-dredge-up 12C/13C and 14N/12C value compared to the non-rotational model on the MS (cf., panels b and c in Fig. 4). This is a result of subsurface changes in the composition profile of our models in early post-MS stages driven by meridional circulation.
The surface nitrogen 14N and 3He increase with the initial rotational velocity, and carbon 12C decreases accordingly (cf., panels a and b in Fig. 4). In contrast, in the fast rotators, the changes in surface abundances due to the dredge-up are small in comparison to the surface enrichment in the non-rotating stars. The reason is that the outer envelope has already been mixed by rotational mixing before the dredge-up. During the first dredge-up, the maximum penetration depth of the convective envelope decreases with the initial rotational velocities and stellar mass. Consequently, our models show that the isotopic ratio 12C/13C decreases, while the ratio 14N/12C and 3He go up at the stellar surface (cf., panels a, b and c in Fig. 4).
However, there are significant numbers of red giants that show smaller values of 12C/13C. In the majority of stars, the 12C/13C ratio is smaller than 20. In one of their stars, the ratio reaches the extreme value of 7.0. On the other hand, the RG stars with a value of 12C/13C below 20 cannot be reproduced by the action of rotational mixing. According to the standard model, the carbon isotopic 12C/13C shows a clear need for extra mixing of some physical mechanisms along the red giant (Lagarde et al. 2019).
A popular theory that offers a solution to extra mixing is thermohaline mixing. The carbon isotopic ratio reduces abruptly when the thermohaline mixing develops in RSG stars. The steeper drop of the 12C/13C ratio in the model of thermohaline mixing (Charbonnel & Lagarde 2010) better reflects the observational data at low stellar masses. The thermohaline mixing in these models occurs after the RGB bump (Charbonnel & Zahn 2007). Its efficiency decreases with the increasing initial stellar mass (cf., panel a in Fig. 3). In that case, at least some of the orange points could be just stars that evolved from those red giant stars with a low 12C/13C (cf., panel a in Fig. 4).
One finds that the ratio of 12C to 13C reduces significantly when the diffusion coefficient of thermohaline mixing is artificially magnified by a large factor of 100 (cf., panel a in Fig. 4). Furthermore, the ratio of 14N to 12C increases significantly due to thermohaline mixing (cf., panel b in Fig. 4). In particular, the observations are the signature of CN cycling (decrease in 12C and increase in 14N), indicating that the thermohaline mixing mechanism connects the envelope to regions in a star where CN cycling is occurring.
From panel b in Fig. 5, one can find that the efficiency of thermohaline mixing increases with the parameter Ct. A larger parameter Ct ≥ 200 can fit the observed lithium abundance well. 3He is produced outside the core via pp chains. When thermohaline mixing sets in at the bump of RC stars, it transfers 3He from the convective envelope down to the hydrogen-burning shell. This leads to a rapid decrease in the surface abundance of 3He, as can be seen in panel c in Fig. 4. Therefore, the thermohaline mixing greatly reduces the 3He abundance, which may affect the 7Li production after the TRGB. A higher value of Ct can cause the lithium enrichment to attain a lower value at a subsequent stage of RC stars (cf., panel b in Fig. 5).
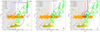 |
Fig. 5. Stellar luminosity as a function of lithium abundance in stars for different models. Panel (a): for different diffusion coefficients of the flash-induced IGW mixing. Panel (b): for different diffusion parameters of the thermohaline mixing without IGWs. Panel (c): for different diffusion parameters of the thermohaline mixing with IGWs. The model with the flash-induced IGW mixing (solid lines, A2 = 1) and without the flash-induced IGW mixing (dashed lines, A2 = 0.0) are indicated in panel (b). yellow circles are RC stars and the green ones are red giant stars. The observational samples are from Kumar et al. (2020). |
3.4. The core helium flash and IGW-induced mixing at the stage of RC stars
After helium ignition at the TRGB, the star evolves down in luminosity and starts core-helium burning, which is also known as the RC phase. An enrichment phase occurring around this time has been proposed over a decade ago (it goes back to Kumar et al. 2011, possibly earlier), and the theory has gained support from asteroseismic observations that show definitively that lithium-rich stars are usually in the RC phase (e.g. Silva Aguirre et al. 2014; Kumar et al. 2018; Singh et al. 2019; Casey et al. 2019). From observations in panel a of Fig. 5, we have noticed that super-Li-rich stars (i.e. A(Li) > 3.2) are almost universally RC stars (Singh et al. 2021; Yan et al. 2021).
The simplest explanation for this is that there is a Li-enrichment phase at the onset of the stage of RC stars or after the core-helium flashing phase. Fig. 6 shows the surface lithium abundance as a function of the evolutionary time from the onset of the helium flash. We find that the duration of lithium enrichment induced by IGW is about 0.2 Myr. This figure clearly shows that lithium enrichment changes with the coefficient A2 (cf., panel a in Fig. 5). The larger coefficient A2 is, the greater the diffusion coefficient Dmix. The mixing timescale induced by the internal gravity waves which can be expressed as tmix = R2/Dmix decrease with the increasing of coefficient A2 (cf., Fig. 6). We find that without the helium flash-induced IGW mixing, the non-rotating star has no lithium enrichment after central helium ignition (cf., panel a in Fig. 5). This is due to the fact that the thermohaline mixing tends to reduce the 3He in the hydrogen-burning shell, which has an impact on the production of lithium. Therefore, the larger coefficient Ct is, the smaller the surface lithium abundance (cf., panel c in Fig. 5). The enrichment of Li mainly occurs from the TRGB under the action of IGW-induced mixing (cf., panel a of Fig. 5). The abundance of lithium-rich RC stars depends on three important physical factors: the lithium abundance at the tip of red giant stars, the intensity of the induced IGW mixing, and the timescale of the lithium enhancement.
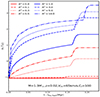 |
Fig. 6. Lithium abundance as a function of evolutionary time from the onset of the helium flash. |
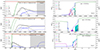 |
Fig. 7. Left panel: various chemical elements in the interior of a 1.3 M⊙ solar metallicity star without rotation at the beginning (upper panel), middle (middle panel), and the terminal stage (bottom panel) of lithium enrichment. Right panel: The various diffusion coefficients (i.e. Dcon: convective motion; Dth: thermohaline mixing; DST: Taylor-spruit dynamo; DES: meridional circulation; Dfim: flash-induced IGW mixing) in the interior of a 1.3 M⊙ solar metallicity star with an initial rotation vini = 100 km/s at the beginning (upper panel), middle (middle panel), and the terminal stage (bottom panel) of lithium enrichment. Grey areas in the right panel represent the convection zone. |
The rotational and the thermohaline mixing tend to reduce the lithium 7Li and 3He abundances from the tip of red giant stars. However, both of them are needed to produce the observed abundance trends in RGB stars. If the diffusion coefficient of IGW-induced mixing is between the values of 108 − 1010 cm2 s−1, the enhancement of the Li abundance is not be located in a specific region of the star (i.e. A(Li) ≤ 1.5 dex)(cf., panel a in Fig. 5 or Fig. 6). If the diffusion coefficient of IGW-induced mixing attains 1010 cm2 s−1 (i.e. A2 = 0.01), it is greater than the ones derived from thermohaline mixing and rotationally induced instabilities. For a larger value of parameter A (i.e. a higher intensity for the induced IGW mixing), the helium flash-induced IGW mixing is mainly responsible for the mixing of the chemical elements. The distribution of the diffusion coefficient shows an outward decreasing trend from the position of the hydrogen-burning shell according to Eq. (2).
If the value of A2 reaches A2 = 10, the increase in the Lithium abundance A(Li) reaches about 3.6 dex. An increase in the diffusion coefficient could lead to more Li enrichment at the position of RC stars (cf., Panel a in Fig. 5). Therefore, super-Li-rich stars can be explained when we adopt a larger diffusion coefficient. Higher luminosity can also favour a larger diffusion coefficient. In fact, only a small fraction of normal stars would have such a large coefficient because the helium-burning shell in these stars has a luminosity that has a value of ∼109 L⊙ at the peak of the flash. The most vigorous Helium subflash can reproduce the observed super 7Li enhancement of stars on the RC star. Yan et al. (2022) discovered nine super-Li-rich unevolved stars with the non-local thermodynamic equilibrium (NLTE) Li abundance A(Li) higher than 3.8 dex from the LAMOST-MRS telescopes, which is the largest sample of these types of stars. Recently, Kowkabany et al. (2024) discovered a star named J0524 − 0336 with an ultra-high lithium abundance of A(Li) = 5.62 ± 0.25. This makes J0524 − 0336 the most lithium-enhanced giant star discovered to date. Internal lithium production in RC stars requires a fast transport process via the Cameron & Fowler mechanism. IGW-induced mixing plays a prime role in transporting 7Be rapidly and can explain this star with a super lithium-rich giant star.
The diffusion coefficient for IGW mixing driven by the IGW was expected to increase with the luminosity as DIGW ≈ f(L)K, where f(L)∝L4/3. Denissenkov et al. (2024) obtained estimates of the IGW diffusion coefficients at the TRGB and bump luminosities. They comment that luminosities between log10(Ltip/L⊙) = 3.3 and log10(Lbump/L⊙) = 1.8 are able to produce Li in amounts comparable to those observed in RGB stars. Denissenkov & Weiss (2000) investigated the effect of rotation-induced mixing (i.e. rotation-driven meridional circulation and turbulent diffusion) on the surface lithium abundance using the diffusion coefficients Dmix. In fact, rotationally induced mixing is considered as a physical mechanism for extra-mixing in low-mass red giants. They also found that the corresponding diffusion coefficient of Dmix (108–1010 cm2 s−1) was too low to lead to lithium enrichment and it invoked the engulfment of a planet in order to trigger the transport process. Planet accretion may explain some lithium-rich giants but it cannot account for the majority that have helium-burning cores. Actually, some investigators have mentioned that Li-rich giants mostly are not in binaries without a high radial velocity (RV) variability (Castro-Tapia et al. 2024). It turns out that values of Dmix ≥ 1011 cm2 s−1 can be obtained only as upper limits for rotation close to the Keplerian one. As a result, only when the diffusion coefficient induced by IGWs is close to 1011 cm2 s−1 at the location between the convective envelope and the hydrogen-burning shell can stars be efficiently enriched in Li.
We wonder why only about 0.2–2% of RC stars are Li-rich A(Li) > 2.0. Singh et al. (2021) have discovered that super-Li-rich stars (i.e. A(Li) > 3.2 dex) are almost universally young RC stars, and Li-normal stars (i.e. A(Li) < 1.0 dex) are predominately older RC stars. The simplest explanation for this is that there is a Li-enrichment phase after the onset of the core-flashing phase. The entire He-flashing phase lasts ∼0.1 − 1.0 Myr. Super-Li-rich stars are mainly influenced by the strong internal gravity wave at the beginning of helium flash. However, Li can also be depleted during the early phases of RC evolution (first ∼40% of RC evolution). It seems more likely that the ‘normal’ RC stars with A(Li) < 1 are mainly affected by the thermohaline mixing due to a weak IGW. The RC phase (i.e. quiescent core-helium burning) lasts for ∼50 Myr. Therefore, about 0.2–2% of low-mass stars go through a super-Li-rich phase.
It is shown in panel b of Fig. 3 that lithium enrichment decreases with stellar mass. For example, surface lithium enrichment can increase from about 0.5 dex to 1.6 dex for a 1.3 M⊙ star whereas it can go up from about 1.35 dex to ∼1.7 dex for a 1.7 M⊙ counterpart. For a given diffusion coefficient and initial lithium abundance, the longer the duration of lithium enrichment is, the greater the surface lithium abundance. This fact indicates that the timescale of the lithium enhancement for less massive stars is longer than the one of more massive stars. This theoretical result is consistent with Zhang et al. (2021) who have noticed that most of Li-rich core-helium-burning stars are dominated by low-mass stars.
Rapidly rotating stars have very low lithium abundances at the tip of red giant stars due to the combined effect of the rotational and thermohaline mixing. However, one can find in panel d in Fig. 3 that the faster the initial rotational rate is, the greater the surface lithium abundance increases for the RC star. For instance, surface lithium enrichment can attain about 2.0 dex for a 1.3 M⊙ star with vini = 65 km/s, whereas it can reach about 6.0 dex for the same counterpart with an initial velocity vini = 150 km/s. A reasonable change in rotational rates could produce more lithium after the core helium flash. The reason is that rotational mixing greatly increases the duration of lithium enrichment (cf., panel a in Fig. 8). For example, the duration for the enrichment event from the TRGB to the position of the RC star is about 0.14 Myr for the non-rotating 1.3 M⊙, whereas it is about 0.2 Myr for the corresponding counterpart with vini = 100 km/s. The right panel in Fig. 8 shows the helium convective core as a function of evolutionary time from the onset of the helium flash for the 1.3 M⊙ stars with different initial rotational velocities. During core-helium burning, rotational mixing brings fresh helium fuel into the longer-lasting convective core, and it transports Helium-burning products outwards. This results in a more massive helium convective core than in the non-rotational case (cf., the right panel in Fig. 8). As a consequence, the exhaustion of helium in the central region is delayed and the lifetime of the core-helium burning lengthens.
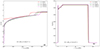 |
Fig. 8. Left panel: change in the convection zone mass over the evolutionary time from the onset of the helium flash for the 1.3 M⊙ solar metallicity stars with different initial rotational velocities. Right panel: lithium abundance as a function of evolutionary time from the onset of the helium flash for the 1.3 M⊙ solar metallicity stars with different initial rotational velocities. |
The ratio of surface chemical elements can provide additional clues about the physical mechanism of IGW-induced mixing. When the helium flash is triggered, the surface abundance of 3He clearly reduces, whereas the ratio of 14N/12C increases greatly. At the subsequent stage, the surface abundance of 3He, and the ratios of 14N/12C and 12C/13C can keep a constant value from the TRGB to the evolutionary position of an RC star. This is due to the fact that the rate of the energy production εH become very low to significantly change these chemical abundances (cf., point F in Fig. 7). Furthermore, internal gravity waves might not operate the whole region between the hydrogen-burning shell and the outer convective envelope. Although internal gravity waves are considered, not all of the region between the H-burning shell and the convective envelope meets the requirement of N2 ≫ Ω2. The temperature at the base of the convective envelope is too low for these chemical elements to be nuclearly processed. Therefore, the chemical elements with full CNO-burning operating at equilibrium show small changes. A very modest decrease in 3He, 7Li, and 12C/13C occurs after the stage of RC stars due to the second dredge-up of the convective envelope (cf., Fig. 4). In fact, the helium flash-induced IGW mixing in Eq. (8) begins to have a low efficiency and is smaller than magnetic diffusion induced by the Taylor-spruit dynamo DST below the outer convective envelope from the evolutionary point F (cf., Point F in Fig. 7). The surface beryllium log(7Be) goes down about 21 dex for the non-rotating model without IGW-induced mixing, whereas it decreases 8.66 dex for the counterpart with IGW-induced mixing (cf., point F in the left panel of Fig. 7). The surface lithium log(7Li) can attain a higher value for the non-rotating model with flash-induced IGW mixing than the one in the counterpart without flash-induced IGW mixing.
3.5. Summary and conclusion
The main conclusions of this paper are summarised below:
– We propose that flash-induced IGW mixing is the most important physical process that may produce lithium enrichment from the helium fresh to the evolutionary position of RC stars.
– Flash-induced IGW mixing is mainly triggered by turbulent convective motions. The larger luminosity produced by the helium flash can provide a larger diffusion coefficient that can explain the super lithium-rich RC stars. For RC stars, flash-induced IGW mixing can reproduce observed data very well. We also provide a reasonable prediction for the observed evolution of the 12C/13C and 14N/12C abundance ratios at the surface of RGB and RC stars.
– Thermohaline mixing is confirmed to be the primary physical process governing the surface abundances of 3He, 7Li, 12C, and 14N for stars more evolved than the RGB bump. Its efficiency decreases with an increasing initial stellar mass. Thermohaline mixing in low-mass giants is capable of destroying large quantities of 3He and 7Li, as well as decreasing the ratios 12C/13C and 12C/14N. In particular, it enormously reduces 3He abundance, which may affect 7Li production after the TRGB. Thermohaline mixing has a very small effect on the diffusion of elements after the core helium flash because its diffusion coefficient is much lower than the one of IGW-induced mixing.
– Our rotational model can reproduce some observational constrains on the internal rotation of stars deduced from asterosismology. Rotational mixing may play a role in setting the surface 7Li abundance on the MS and RGB. Rotation seems an unlikely explanation for a lithium enrichment event occurring after the tip of the red giant star due to a lower diffusion coefficient. Rapid rotation may reduce the efficiency of thermohaline mixing. The reason seems to be that the 7Li abundance on the RGB bump is low because rapid rotation tends to reduce the 7Li abundance before the RGB bump. Rapid rotation can also increase the efficiency of flash-induced IGW mixing because rotational mixing can increase the timescale of flash-induced IGW mixing.
The percentage of Li-rich giant stars is around 1.0% (Brown et al. 1989; Gao et al. 2019; Martell et al. 2021).
Acknowledgments
This work was sponsored by the National Natural Science Foundation of China (Grant Nos. 11863003, 12173010), GM and SE have received funding from the European Research Council (ERC) under the European Union’s Horizon 2020 research and innovation programme (grant agreement No 833925, project STAREX), Science and technology plan projects of Guizhou province (Grant No. [2018]5781). Dr. Y. Qin gratefully acknowledges the National Natural Science Foundation of China (Grant No. 12473036).
References
- Adamów, M., Niedzielski, A., Villaver, E., Wolszczan, A., & Nowak, G. 2014, A&A, 569, A55 [NASA ADS] [CrossRef] [EDP Sciences] [Google Scholar]
- Asplund, M., Grevesse, N., Sauval, A. J., & Scott, P. 2009, ARA&A, 47, 481 [NASA ADS] [CrossRef] [Google Scholar]
- Braun, H. 1997, PhD thesis, Ludwig-Maximilians University of Munich, Germany [Google Scholar]
- Brown, J. A., Sneden, C., Lambert, D. L., & Dutchover, E., Jr 1989, ApJS, 71, 293 [NASA ADS] [CrossRef] [Google Scholar]
- Buder, S., Asplund, M., Duong, L., et al. 2018, MNRAS, 478, 4513 [Google Scholar]
- Casey, A. R., Ho, A. Y. Q., Ness, M., et al. 2019, ApJ, 880, 125 [Google Scholar]
- Castro-Tapia, M., Aguilera-Gómez, C., & Chanamé, J. 2024, A&A, 690, A367 [NASA ADS] [CrossRef] [EDP Sciences] [Google Scholar]
- Chanamé, J., Pinsonneault, M., & Terndrup, D. M. 2005, ApJ, 631, 540 [Google Scholar]
- Charbonnel, C. 1995, ApJ, 453, L41 [NASA ADS] [CrossRef] [Google Scholar]
- Charbonnel, C., & Balachandran, S. C. 2000, A&A, 359, 563 [Google Scholar]
- Charbonnel, C., & Lagarde, N. 2010, A&A, 522, A10 [CrossRef] [EDP Sciences] [Google Scholar]
- Charbonnel, C., & Zahn, J. P. 2007, A&A, 467, L15 [NASA ADS] [CrossRef] [EDP Sciences] [Google Scholar]
- Charbonnel, C., Lagarde, N., Jasniewicz, G., et al. 2020, A&A, 633, A34 [NASA ADS] [CrossRef] [EDP Sciences] [Google Scholar]
- Deepak, & Reddy, B. E. 2019, MNRAS, 484, 2000 [NASA ADS] [Google Scholar]
- de La Reza, R., Drake, N. A., & da Silva, L. 2003, ASP Conf. Ser., 304, 114 [NASA ADS] [Google Scholar]
- Denissenkov, P. A., & Weiss, A. 2000, A&A, 358, L49 [NASA ADS] [Google Scholar]
- Denissenkov, P. A., Pinsonneault, M., & MacGregor, K. B. 2008, ApJ, 684, 757 [NASA ADS] [CrossRef] [Google Scholar]
- Denissenkov, P. A., Blouin, S., Herwig, F., Stott, J., & Woodward, P. R. 2024, MNRAS, 535, 1243 [NASA ADS] [CrossRef] [Google Scholar]
- Eggleton, P. 2006, Evolutionary Processes in Binary and Multiple Stars (Cambridge: Cambridge University Press) [Google Scholar]
- Endal, A. S., & Sofia, S. 1978, ApJ, 220, 279 [NASA ADS] [CrossRef] [Google Scholar]
- Gaia Collaboration 2018, VizieR On-line Data Catalog: I/345 [Google Scholar]
- Gao, Q., Shi, J.-R., Yan, H.-L., et al. 2019, ApJS, 245, 33 [NASA ADS] [CrossRef] [Google Scholar]
- Gao, J., Zhu, C., Yu, J., et al. 2022, A&A, 668, A126 [NASA ADS] [CrossRef] [EDP Sciences] [Google Scholar]
- Gehan, C., Mosser, B., Michel, E., Samadi, R., & Kallinger, T. 2018, A&A, 616, A24 [NASA ADS] [CrossRef] [EDP Sciences] [Google Scholar]
- Goldreich, P., & Schubert, G. 1967, ApJ, 150, 571 [Google Scholar]
- Gratton, R. G., Sneden, C., Carretta, E., & Bragaglia, A. 2000, A&A, 354, 169 [NASA ADS] [Google Scholar]
- Grevesse, N., & Sauval, A. J. 1998, Space Sci. Rev., 85, 161 [Google Scholar]
- Heger, A., Woosley, S. E., & Spruit, H. C. 2005, ApJ, 626, 350 [Google Scholar]
- Iben, I., Jr 1967, ApJ, 147, 624 [NASA ADS] [CrossRef] [Google Scholar]
- Kippenhahn, R., Ruschenplatt, G., & Thomas, H. C. 1980, A&A, 91, 175 [Google Scholar]
- Kowkabany, J., Ezzeddine, R., Charbonnel, C., et al. 2024, ApJ, 973, 125 [NASA ADS] [CrossRef] [Google Scholar]
- Kumar, Y. B., Reddy, B. E., & Lambert, D. L. 2011, ApJ, 730, L12 [NASA ADS] [CrossRef] [Google Scholar]
- Kumar, Y. B., Reddy, B. E., & Zhao, G. 2018, J. Astrophys. Astron., 39, 25 [NASA ADS] [CrossRef] [Google Scholar]
- Kumar, Y. B., Reddy, B. E., Campbell, S. W., et al. 2020, Nat. Astron., 4, 1059 [NASA ADS] [CrossRef] [Google Scholar]
- Lagarde, N., Reylé, C., Robin, A. C., et al. 2019, A&A, 621, A24 [NASA ADS] [CrossRef] [EDP Sciences] [Google Scholar]
- Langer, N. 2012, ARA&A, 50, 107 [CrossRef] [Google Scholar]
- Li, X.-F., Shi, J.-R., Li, Y., Yan, H.-L., & Zhang, J.-H. 2023, ApJ, 943, 115 [NASA ADS] [CrossRef] [Google Scholar]
- Magrini, L., Smiljanic, R., Franciosini, E., et al. 2021, A&A, 655, A23 [NASA ADS] [CrossRef] [EDP Sciences] [Google Scholar]
- Martell, S. L., Simpson, J. D., Balasubramaniam, A. G., et al. 2021, MNRAS, 505, 5340 [NASA ADS] [Google Scholar]
- McCormick, C., Majewski, S. R., Smith, V. V., et al. 2023, MNRAS, 524, 4418 [CrossRef] [Google Scholar]
- Mikolaitis, Š., Tautvaišienė, G., Gratton, R., Bragaglia, A., & Carretta, E. 2012, A&A, 541, A137 [NASA ADS] [CrossRef] [EDP Sciences] [Google Scholar]
- Montalban, J. 1994, A&A, 281, 421 [NASA ADS] [Google Scholar]
- Montalban, J., & Schatzman, E. 1996, A&A, 305, 513 [NASA ADS] [Google Scholar]
- Montalbán, J., & Schatzman, E. 2000, A&A, 354, 943 [Google Scholar]
- Mosser, B., Goupil, M. J., Belkacem, K., et al. 2012, A&A, 548, A10 [NASA ADS] [CrossRef] [EDP Sciences] [Google Scholar]
- Moyano, F. D., Eggenberger, P., Mosser, B., & Spada, F. 2023, A&A, 673, A110 [NASA ADS] [CrossRef] [EDP Sciences] [Google Scholar]
- Palacios, A., Talon, S., Charbonnel, C., & Forestini, M. 2003, A&A, 399, 603 [CrossRef] [EDP Sciences] [Google Scholar]
- Palmerini, S., Cristallo, S., Busso, M., et al. 2011, ApJ, 741, 26 [NASA ADS] [CrossRef] [Google Scholar]
- Paxton, B., Bildsten, L., Dotter, A., et al. 2011, ApJS, 192, 3 [Google Scholar]
- Paxton, B., Cantiello, M., Arras, P., et al. 2013, ApJS, 208, 4 [Google Scholar]
- Paxton, B., Marchant, P., Schwab, J., et al. 2015, ApJS, 220, 15 [Google Scholar]
- Paxton, B., Schwab, J., Bauer, E. B., et al. 2018, ApJS, 234, 34 [NASA ADS] [CrossRef] [Google Scholar]
- Paxton, B., Smolec, R., Schwab, J., et al. 2019, ApJS, 243, 10 [Google Scholar]
- Reimers, D. 1975, Mem. Soc. Royale Sci. Liege, 8, 369 [NASA ADS] [Google Scholar]
- Schwab, J. 2020, ApJ, 901, L18 [NASA ADS] [CrossRef] [Google Scholar]
- Silva Aguirre, V., Ruchti, G. R., Hekker, S., et al. 2014, ApJ, 784, L16 [NASA ADS] [CrossRef] [Google Scholar]
- Singh, R., Reddy, B. E., Bharat Kumar, Y., & Antia, H. M. 2019, ApJ, 878, L21 [NASA ADS] [CrossRef] [Google Scholar]
- Singh, R., Reddy, B. E., Campbell, S. W., Kumar, Y. B., & Vrard, M. 2021, ApJ, 913, L4 [NASA ADS] [CrossRef] [Google Scholar]
- Spada, F., Gellert, M., Arlt, R., & Deheuvels, S. 2016, A&A, 589, A23 [NASA ADS] [CrossRef] [EDP Sciences] [Google Scholar]
- Spite, M., & Spite, F. 1982, Nature, 297, 483 [NASA ADS] [CrossRef] [Google Scholar]
- Spruit, H. C. 2002, A&A, 381, 923 [CrossRef] [EDP Sciences] [Google Scholar]
- Stern, M. E. 1960, Tellus, 12, 172 [Google Scholar]
- Sweigart, A. V., & Mengel, J. G. 1979, ApJ, 229, 624 [NASA ADS] [CrossRef] [Google Scholar]
- Tajitsu, A., Sadakane, K., Naito, H., Arai, A., & Aoki, W. 2015, Nature, 518, 381 [NASA ADS] [CrossRef] [Google Scholar]
- Tautvaišienė, G., Edvardsson, B., Puzeras, E., Barisevičius, G., & Ilyin, I. 2010, MNRAS, 409, 1213 [CrossRef] [Google Scholar]
- Tautvaišienė, G., Barisevičius, G., Chorniy, Y., Ilyin, I., & Puzeras, E. 2013, MNRAS, 430, 621 [CrossRef] [Google Scholar]
- Ulrich, R. K. 1972, ApJ, 172, 165 [NASA ADS] [CrossRef] [Google Scholar]
- Vassiliadis, E., & Wood, P. R. 1993, ApJ, 413, 641 [Google Scholar]
- Wellstein, S., Langer, N., & Braun, H. 2001, A&A, 369, 939 [NASA ADS] [CrossRef] [EDP Sciences] [Google Scholar]
- Yan, H.-L., Shi, J.-R., Zhou, Y.-T., et al. 2018, Nat. Astron., 2, 790 [NASA ADS] [CrossRef] [Google Scholar]
- Yan, H.-L., Zhou, Y.-T., Zhang, X., et al. 2021, Nat. Astron., 5, 86 [NASA ADS] [CrossRef] [Google Scholar]
- Yan, T. S., Shi, J. R., Wang, L., et al. 2022, ApJ, 929, L14 [NASA ADS] [CrossRef] [Google Scholar]
- Zhang, X.-F., Jeffery, C. S., Li, Y., & Bi, S. 2020, ApJ, 889, 33 [NASA ADS] [CrossRef] [Google Scholar]
- Zhang, J.-H., Shi, J.-R., Yan, H.-L., et al. 2021, ApJ, 919, L3 [NASA ADS] [CrossRef] [Google Scholar]
All Figures
|
Fig. 1. Evolution tracks in the Hertzsprung–Russell diagram of the stars with a different initial mass and rotational velocities in panel (a). Each curve with different colours refers to a different mass. Panel (b) shows the evolutionary curves in the log Teff − log g diagram. Point A denotes the zero age main sequence and point B represents the turn-off point of the MS. Point C is the stage of the first dredge-up. Points D, E, and F are the beginning (i.e. the tip of red giant star), midpoint, and end of lithium enrichment. Point G is the local maximal luminosity next to an RC star and point H is the core-helium exhaustion. |
| In the text | |
|
Fig. 2. Evolution of the angular velocity as a function of the distance to the center in a 1.3 M⊙ star. Left panel: evolution of angular velocity for the model 1.3 M⊙ with different initial velocities. Each curve with different colours refers to a different epoch. The epoch has been indicated in the legend. Evolution of the core and surface and core rotational rates as a function of the gravity for a 1.3 M⊙ star. Right panel: evolution of the core and surface rotation rates for models with different initial velocities. The grey triangles correspond to red giants in the lower RGB (Gehan et al. 2018). The magenta circles correspond to red giants presented by Mosser et al. (2012) with those grouped around log g ∼ 2.5 in the core-helium-burning phase. |
| In the text | |
|
Fig. 3. Stellar luminosity as a function of the lithium abundance in stars for different models. Panel (a): stellar luminosity as a function of the lithium abundance in stars with different stellar mass without IGWs. Panel (b): stellar luminosity as a function of the lithium abundance in stars with different stellar mass with IGWs. Panel (c): stellar luminosity as a function of the lithium abundance in stars with a 1.3 M⊙ model in different initial rotational velocities without IGWs. Panel (d): stellar luminosity as a function of the lithium abundance in stars with different initial rotational velocities with IGWs. The yellow circles are RC stars and the green ones are red giant stars. They are from Kumar et al. (2020). |
| In the text | |
|
Fig. 4. Panel (a): carbon isotope ratios of 12C/13C as a function of the effective temperature for the 1.3 M⊙ solar metallicity stars with different initial rotational velocities. Panel (b): for the ratios of 14N/12C. Panel (c): for the 3He. The model with the thermohaline mixing (solid lines) and without the thermohaline mixing (dashed lines) are indicated in three panels. The observational samples are from these references (Tautvaišienė et al. 2010, 2013; Mikolaitis et al. 2012; de La Reza et al. 2003; McCormick et al. 2023). |
| In the text | |
|
Fig. 5. Stellar luminosity as a function of lithium abundance in stars for different models. Panel (a): for different diffusion coefficients of the flash-induced IGW mixing. Panel (b): for different diffusion parameters of the thermohaline mixing without IGWs. Panel (c): for different diffusion parameters of the thermohaline mixing with IGWs. The model with the flash-induced IGW mixing (solid lines, A2 = 1) and without the flash-induced IGW mixing (dashed lines, A2 = 0.0) are indicated in panel (b). yellow circles are RC stars and the green ones are red giant stars. The observational samples are from Kumar et al. (2020). |
| In the text | |
|
Fig. 6. Lithium abundance as a function of evolutionary time from the onset of the helium flash. |
| In the text | |
|
Fig. 7. Left panel: various chemical elements in the interior of a 1.3 M⊙ solar metallicity star without rotation at the beginning (upper panel), middle (middle panel), and the terminal stage (bottom panel) of lithium enrichment. Right panel: The various diffusion coefficients (i.e. Dcon: convective motion; Dth: thermohaline mixing; DST: Taylor-spruit dynamo; DES: meridional circulation; Dfim: flash-induced IGW mixing) in the interior of a 1.3 M⊙ solar metallicity star with an initial rotation vini = 100 km/s at the beginning (upper panel), middle (middle panel), and the terminal stage (bottom panel) of lithium enrichment. Grey areas in the right panel represent the convection zone. |
| In the text | |
|
Fig. 8. Left panel: change in the convection zone mass over the evolutionary time from the onset of the helium flash for the 1.3 M⊙ solar metallicity stars with different initial rotational velocities. Right panel: lithium abundance as a function of evolutionary time from the onset of the helium flash for the 1.3 M⊙ solar metallicity stars with different initial rotational velocities. |
| In the text | |
Current usage metrics show cumulative count of Article Views (full-text article views including HTML views, PDF and ePub downloads, according to the available data) and Abstracts Views on Vision4Press platform.
Data correspond to usage on the plateform after 2015. The current usage metrics is available 48-96 hours after online publication and is updated daily on week days.
Initial download of the metrics may take a while.