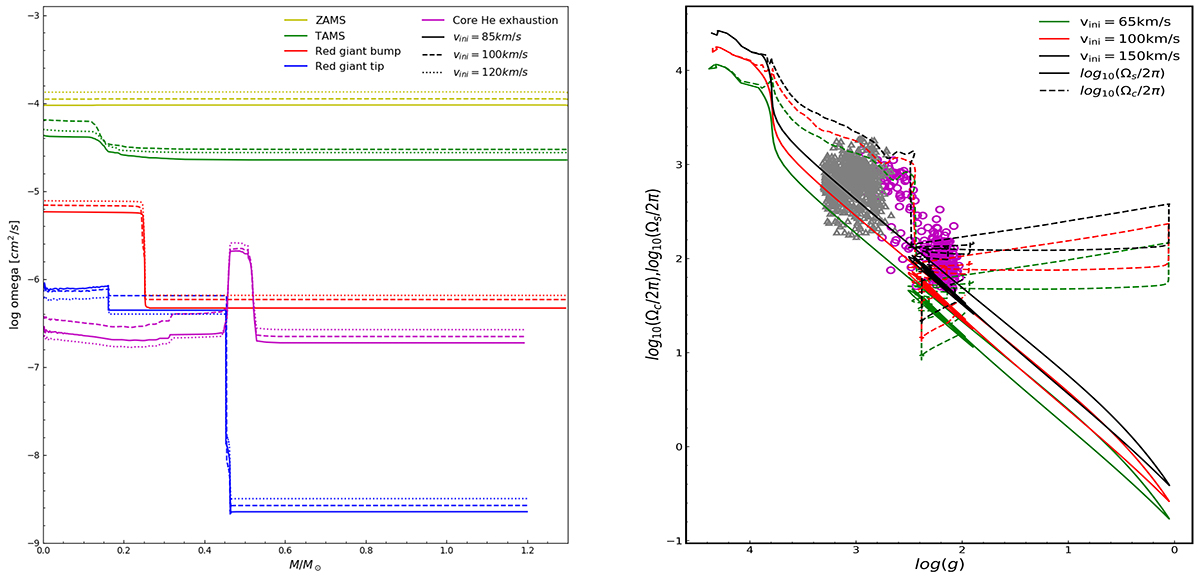
Fig. 2.
Download original image
Evolution of the angular velocity as a function of the distance to the center in a 1.3 M⊙ star. Left panel: evolution of angular velocity for the model 1.3 M⊙ with different initial velocities. Each curve with different colours refers to a different epoch. The epoch has been indicated in the legend. Evolution of the core and surface and core rotational rates as a function of the gravity for a 1.3 M⊙ star. Right panel: evolution of the core and surface rotation rates for models with different initial velocities. The grey triangles correspond to red giants in the lower RGB (Gehan et al. 2018). The magenta circles correspond to red giants presented by Mosser et al. (2012) with those grouped around log g ∼ 2.5 in the core-helium-burning phase.
Current usage metrics show cumulative count of Article Views (full-text article views including HTML views, PDF and ePub downloads, according to the available data) and Abstracts Views on Vision4Press platform.
Data correspond to usage on the plateform after 2015. The current usage metrics is available 48-96 hours after online publication and is updated daily on week days.
Initial download of the metrics may take a while.