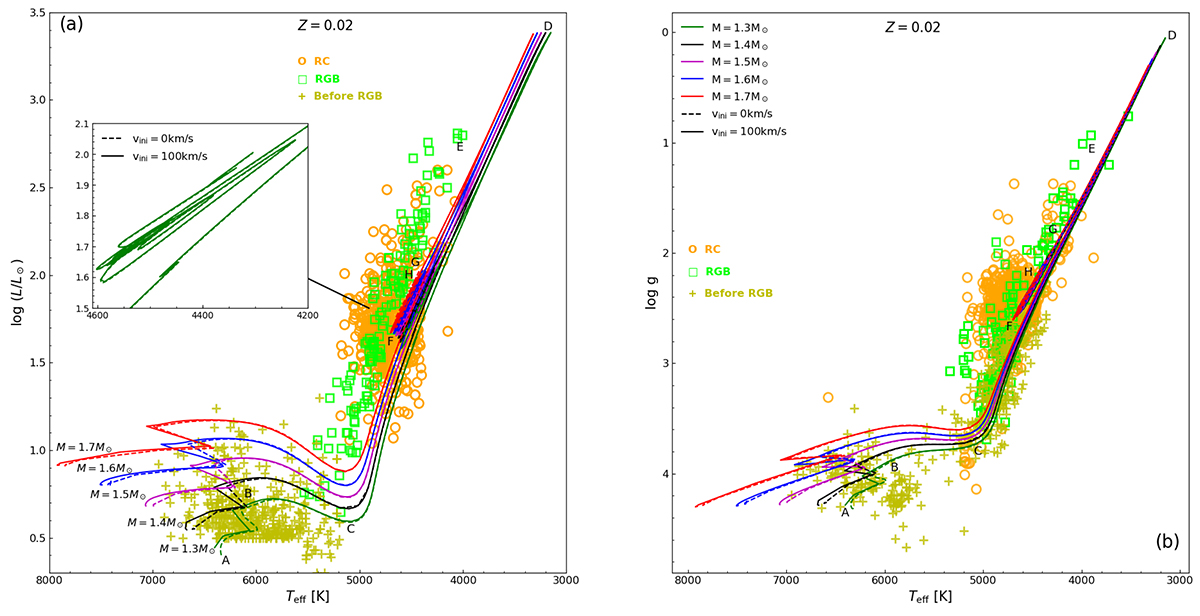
Fig. 1.
Download original image
Evolution tracks in the Hertzsprung–Russell diagram of the stars with a different initial mass and rotational velocities in panel (a). Each curve with different colours refers to a different mass. Panel (b) shows the evolutionary curves in the log Teff − log g diagram. Point A denotes the zero age main sequence and point B represents the turn-off point of the MS. Point C is the stage of the first dredge-up. Points D, E, and F are the beginning (i.e. the tip of red giant star), midpoint, and end of lithium enrichment. Point G is the local maximal luminosity next to an RC star and point H is the core-helium exhaustion.
Current usage metrics show cumulative count of Article Views (full-text article views including HTML views, PDF and ePub downloads, according to the available data) and Abstracts Views on Vision4Press platform.
Data correspond to usage on the plateform after 2015. The current usage metrics is available 48-96 hours after online publication and is updated daily on week days.
Initial download of the metrics may take a while.