Fig. 4.
Download original image
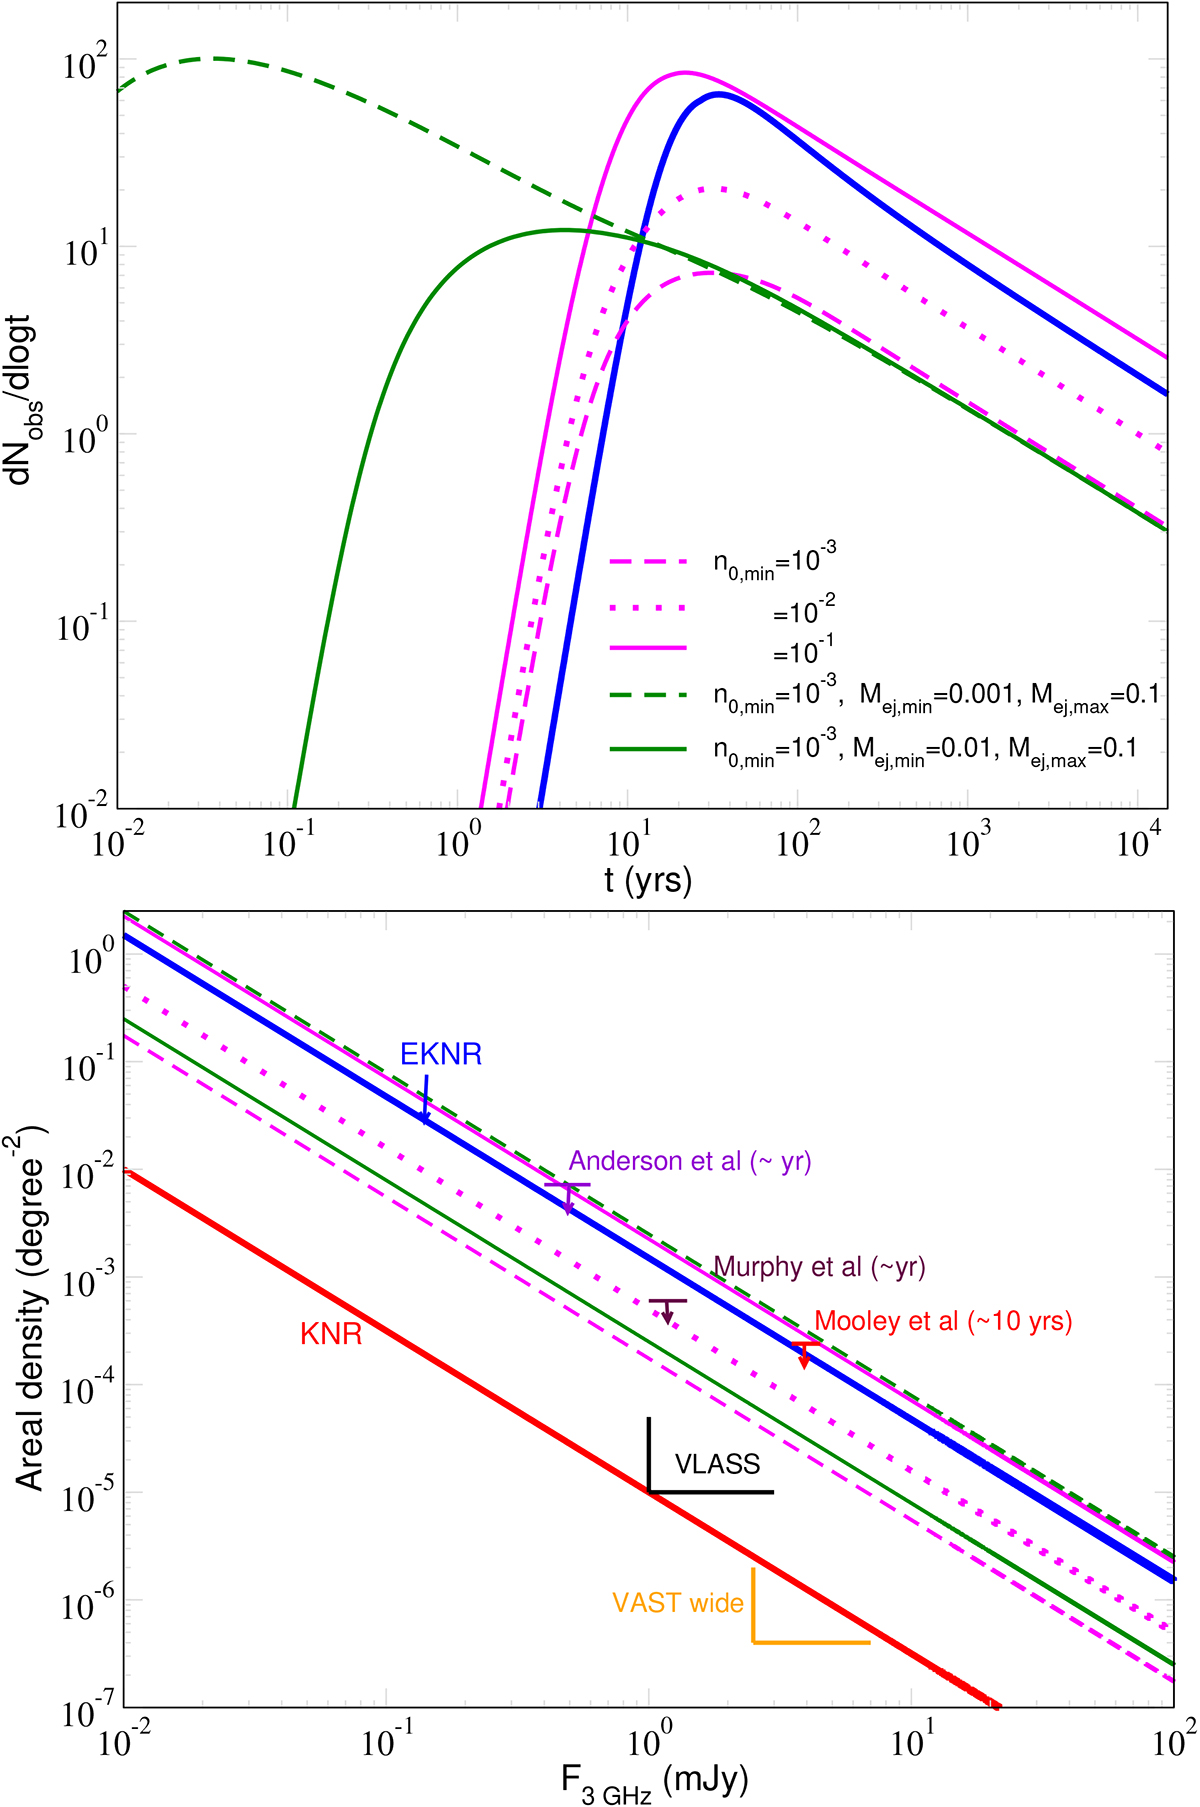
Dependence of EKNR abundance on surrounding density and mass distribution. Top: ![]() for EKNRs taking a distribution of external densities n0 with
for EKNRs taking a distribution of external densities n0 with ![]() and varying n0, min and a (Eq. (30)) shown by different line styles. In green, we consider a distribution over both density and ejecta mass but not over ejecta energy. For reference, we show our fiducial case of EKNR as in Fig. 3 in solid blue lines. Bottom: Areal density for the same cases as in the top panel. We also show the KNR case from Fig. 3, which is a factor of about 102 − 103 smaller than the EKNR cases. We have used the results of Anderson et al. 2020, Murphy et al. 2021, Mooley et al. 2022 as upper limits, because these authors do not detect a KNR.
and varying n0, min and a (Eq. (30)) shown by different line styles. In green, we consider a distribution over both density and ejecta mass but not over ejecta energy. For reference, we show our fiducial case of EKNR as in Fig. 3 in solid blue lines. Bottom: Areal density for the same cases as in the top panel. We also show the KNR case from Fig. 3, which is a factor of about 102 − 103 smaller than the EKNR cases. We have used the results of Anderson et al. 2020, Murphy et al. 2021, Mooley et al. 2022 as upper limits, because these authors do not detect a KNR.
Current usage metrics show cumulative count of Article Views (full-text article views including HTML views, PDF and ePub downloads, according to the available data) and Abstracts Views on Vision4Press platform.
Data correspond to usage on the plateform after 2015. The current usage metrics is available 48-96 hours after online publication and is updated daily on week days.
Initial download of the metrics may take a while.