Fig. 3.
Download original image
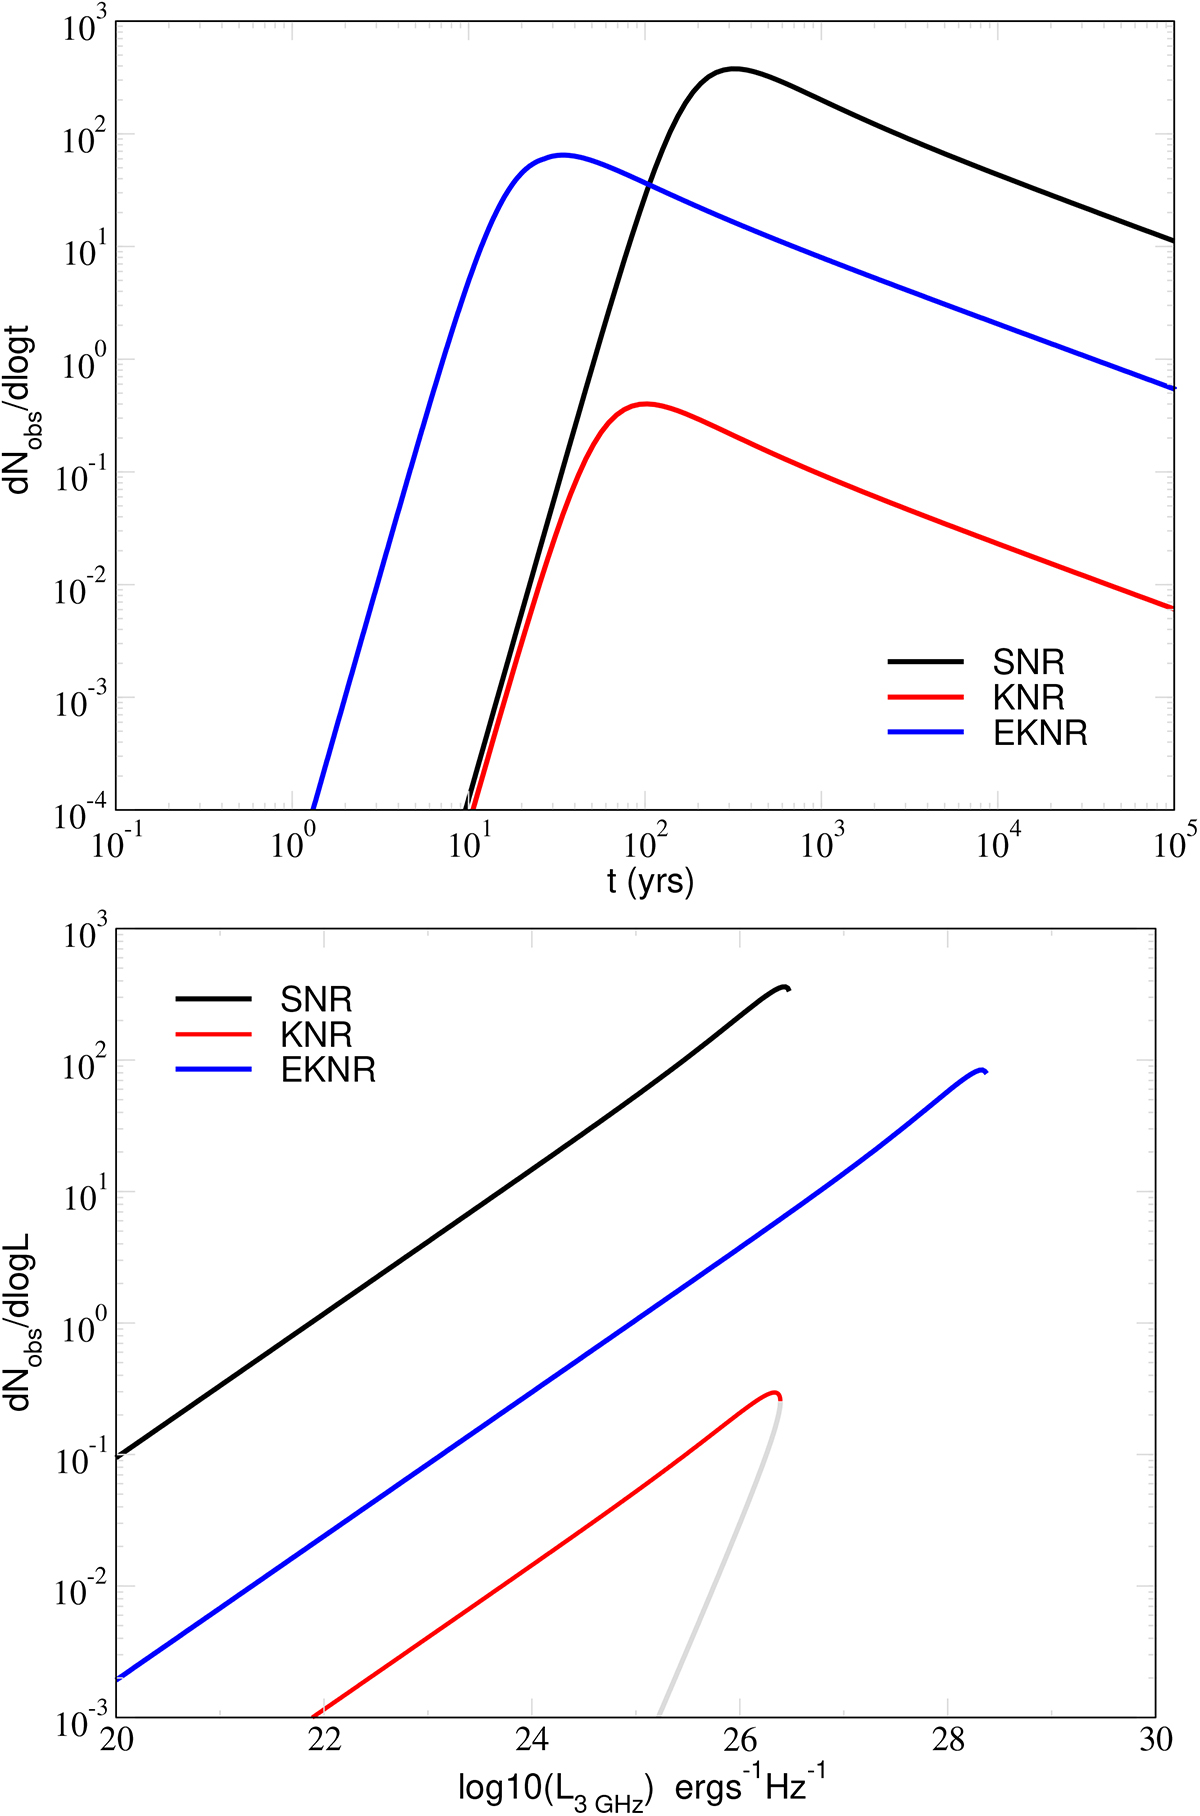
Abundance of SNR, KNR and EKNRs. Top: Number of systems observed by an all-sky radio survey per logarithmic unit of age, ![]() , for SNR, KNR, and EKNRs. Bottom:
, for SNR, KNR, and EKNRs. Bottom: ![]() for the same cases as in the upper panel. For the SN case, we show
for the same cases as in the upper panel. For the SN case, we show ![]() for the coasting regime in grey in order to highlight its non-monotonic nature. We assume a minimum flux threshold of Fths = 1 mJy, an observation frequency of 3 GHz, and fiducial ejecta parameters as in Fig. 1. EKNRs evolve on a short-enough timescale for their evolution to be observable (as explored in more detail in Fig. 5).
for the coasting regime in grey in order to highlight its non-monotonic nature. We assume a minimum flux threshold of Fths = 1 mJy, an observation frequency of 3 GHz, and fiducial ejecta parameters as in Fig. 1. EKNRs evolve on a short-enough timescale for their evolution to be observable (as explored in more detail in Fig. 5).
Current usage metrics show cumulative count of Article Views (full-text article views including HTML views, PDF and ePub downloads, according to the available data) and Abstracts Views on Vision4Press platform.
Data correspond to usage on the plateform after 2015. The current usage metrics is available 48-96 hours after online publication and is updated daily on week days.
Initial download of the metrics may take a while.