Fig. 6.
Download original image
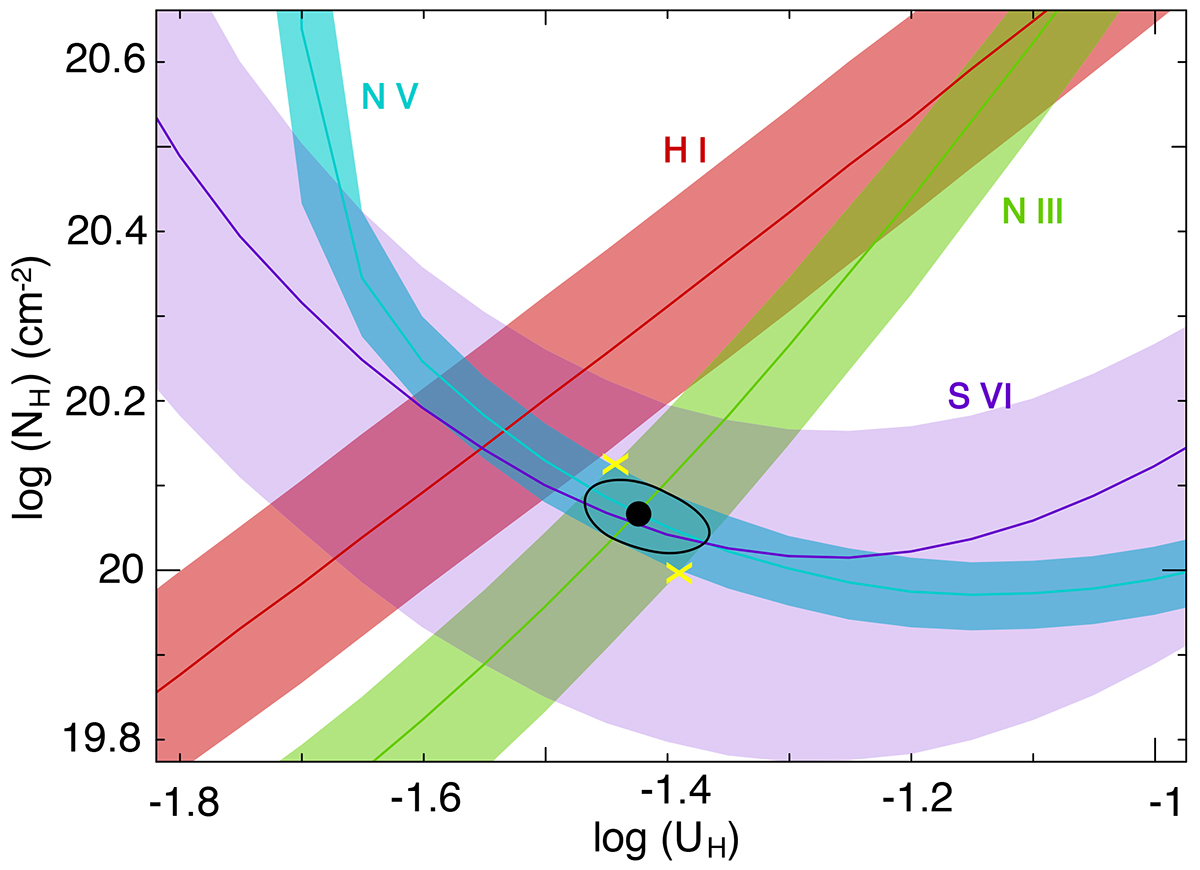
Photoionization solution for the outflow detected in 3C 298. Each colored contour indicates the ionic column densities consistent with the observations (presented in Table 2), assuming the HE0238 SED and solar abundances. The solid lines show the measured value, and the shaded bands show the uncertainties. The black dot shows the best solution for N III and N V, and the 1σ uncertainty is shown by the black oval. The two yellow crosses show the allowed uncertainty region we used to determine the absolute abundances (see Appendix A).
Current usage metrics show cumulative count of Article Views (full-text article views including HTML views, PDF and ePub downloads, according to the available data) and Abstracts Views on Vision4Press platform.
Data correspond to usage on the plateform after 2015. The current usage metrics is available 48-96 hours after online publication and is updated daily on week days.
Initial download of the metrics may take a while.