Fig. 4.
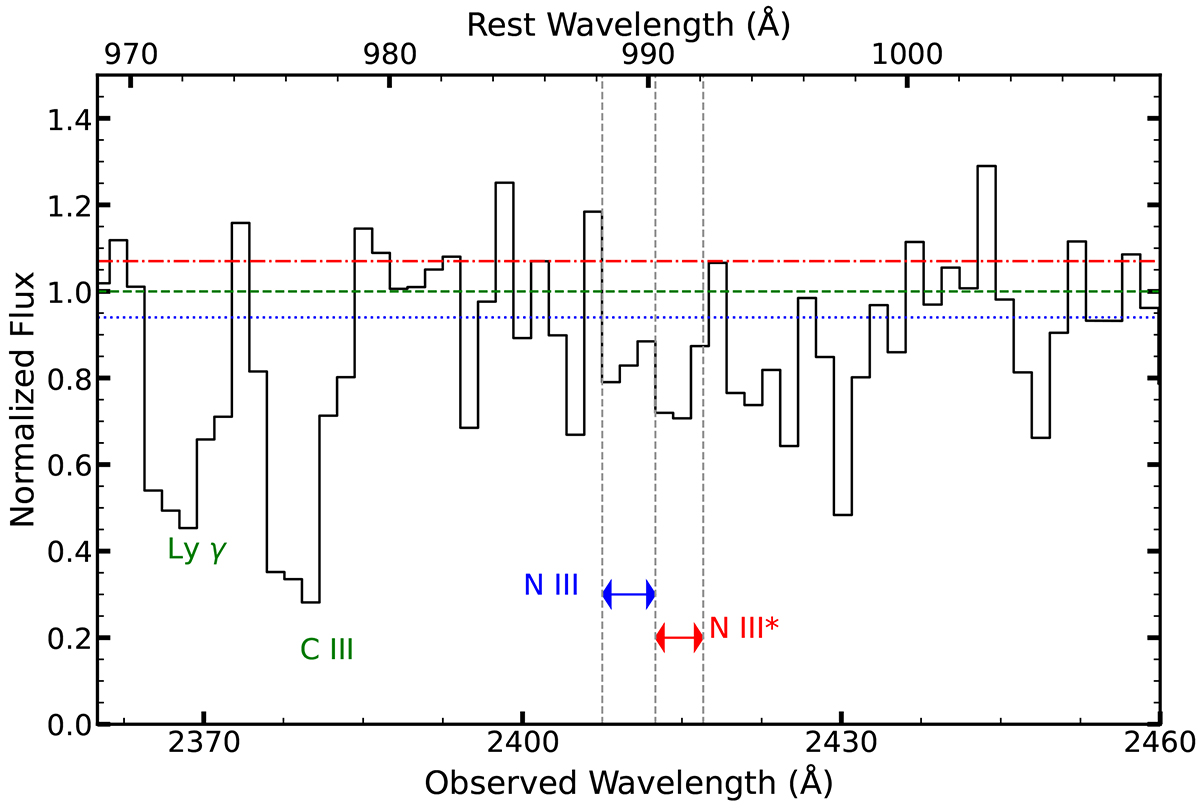
Download original image
Absorption line profiles for the quasar 3C298, plotted against velocity in km s−1 in the regions around N III and NIII*. The normalized flux is shown on the y-axis, and the absorption lines of Lyϵ, C III, N III, and NIII* are labeled. The dashed green line shows the local continuum model, and the dashed red and dotted blue lines show the ±5% uncertainties. The integration range for N III and NIII* is also shown with blue and red arrows, respectively.
Current usage metrics show cumulative count of Article Views (full-text article views including HTML views, PDF and ePub downloads, according to the available data) and Abstracts Views on Vision4Press platform.
Data correspond to usage on the plateform after 2015. The current usage metrics is available 48-96 hours after online publication and is updated daily on week days.
Initial download of the metrics may take a while.