Open Access
Fig. 2.
Download original image
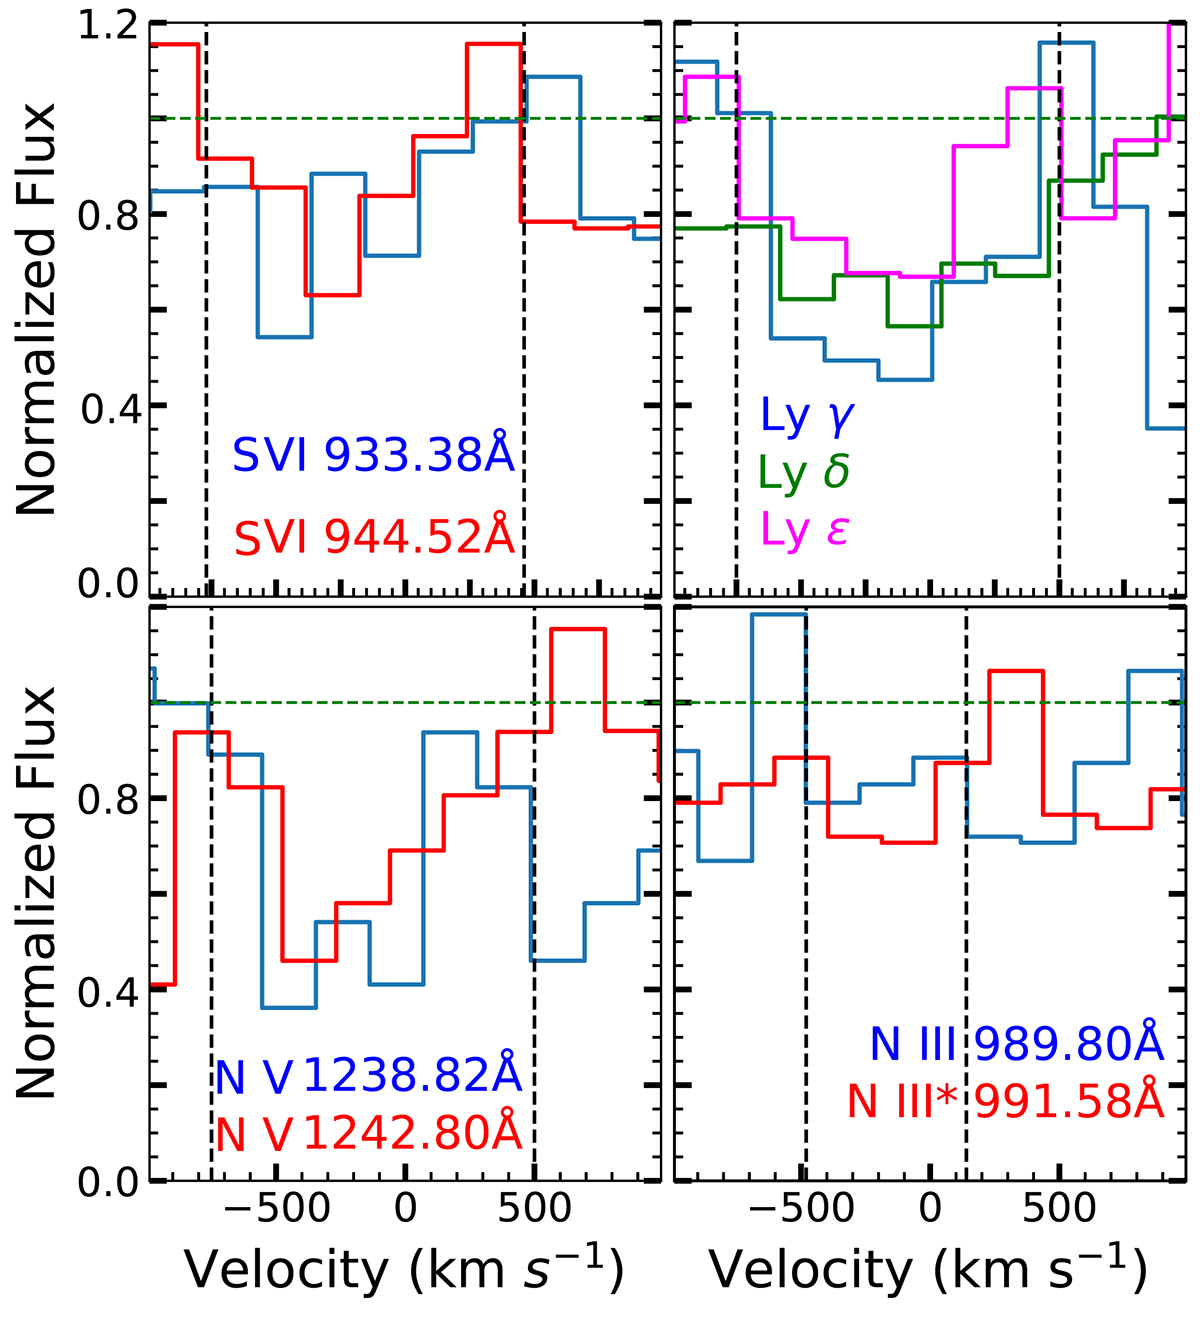
Normalized flux vs. velocity for the blueshifted absorption lines detected in the spectrum of 3C298. The dashed horizontal green line shows the continuum level, and the vertical dashed black lines show the integration region for each line.
Current usage metrics show cumulative count of Article Views (full-text article views including HTML views, PDF and ePub downloads, according to the available data) and Abstracts Views on Vision4Press platform.
Data correspond to usage on the plateform after 2015. The current usage metrics is available 48-96 hours after online publication and is updated daily on week days.
Initial download of the metrics may take a while.