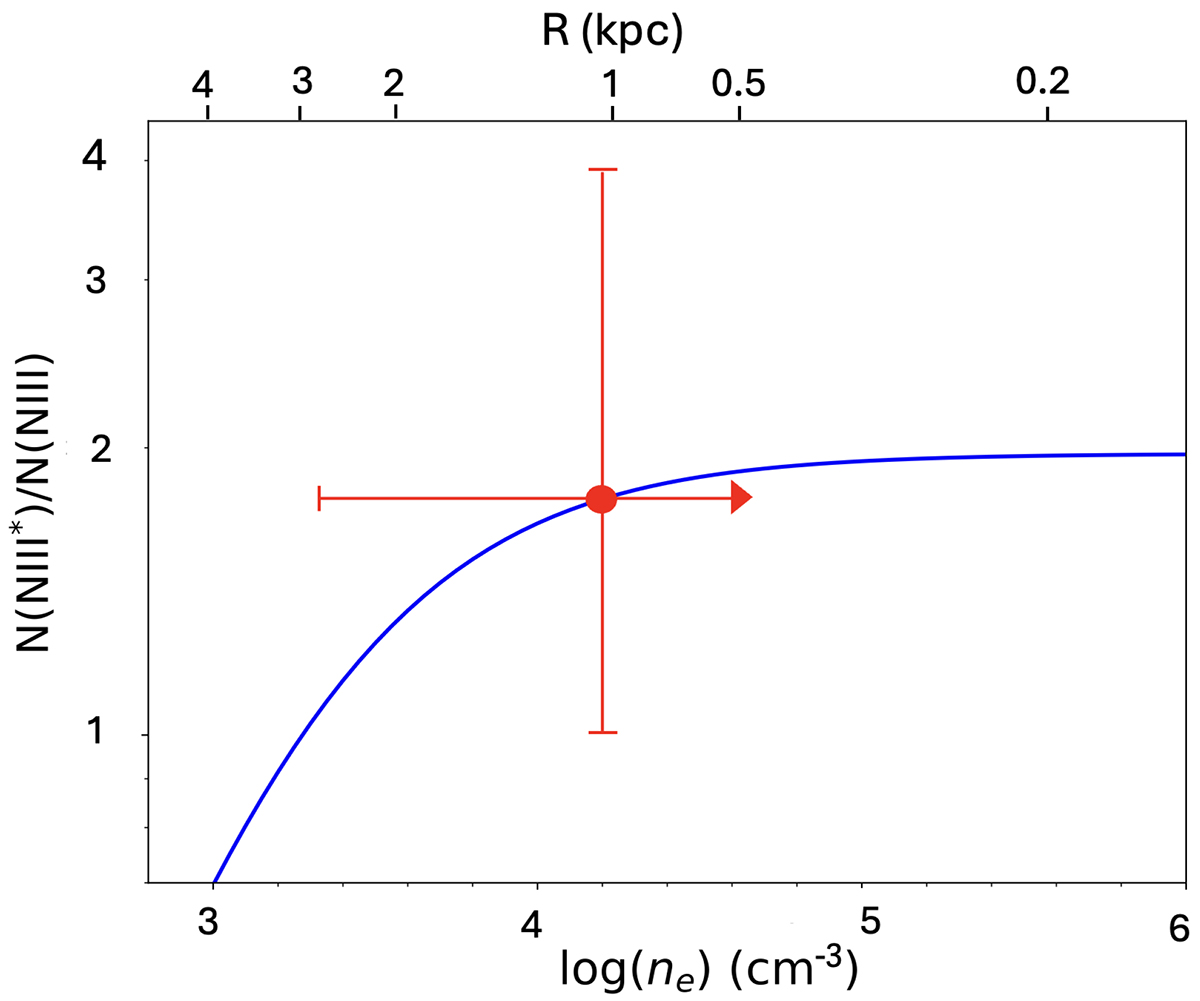
Fig. 10.
Download original image
Excited state (E = 174.4 cm−1) to resonance state column density ratio of N III vs. the electron number density (blue curve) from the Chianti atomic database for T = 16 000 K. The measured ratio is shown by the red dot, and the accompanying error bars are shown by the vertical red lines. The 174.4 cm−1 transition in N III arises from the 2P3/2 → 2P1/2 transition within this ion.
Current usage metrics show cumulative count of Article Views (full-text article views including HTML views, PDF and ePub downloads, according to the available data) and Abstracts Views on Vision4Press platform.
Data correspond to usage on the plateform after 2015. The current usage metrics is available 48-96 hours after online publication and is updated daily on week days.
Initial download of the metrics may take a while.