| Issue |
A&A
Volume 693, January 2025
|
|
|---|---|---|
| Article Number | A253 | |
| Number of page(s) | 18 | |
| Section | Extragalactic astronomy | |
| DOI | https://doi.org/10.1051/0004-6361/202452034 | |
| Published online | 28 January 2025 | |
The Lyman Alpha Reference Sample
XVI. Global 21 cm HI properties of Lyman-α emitting galaxies
1
The Oskar Klein Centre, Department of Astronomy, Stockholm University, AlbaNova, SE-10691 Stockholm, Sweden
2
Minnesota Institute for Astrophysics, University of Minnesota, 116 Church Street SE, Minneapolis, MN 55455, USA
3
Department of Physics and Astronomy, Macalester College, 1600 Grand Avenue, Saint Paul, MN 55105, USA
4
Inter-University Centre for Astronomy and Astrophysics (IUCAA), Pune University Campus, Pune 411 007, India
5
Observatoire de Genève, Université de Genève, Chemin Pegasi 51, 1290 Versoix, Switzerland
6
Institut d’Astrophysique de Paris, 98 bis Boulevard Arago, F-75014 Paris, France
⋆ Corresponding author; This email address is being protected from spambots. You need JavaScript enabled to view it.
Received:
28
August
2024
Accepted:
30
October
2024
Abstract
Context. The Lyman-α (Lyα) line of hydrogen is a well-known tracer of galaxies at high redshift. However, the connection between Lyα observables and galaxy properties has not been fully established, limiting the use of the line to probe the physics of galaxies.
Aims. Here, we derive the global neutral hydrogen gas (HI) properties of nearby Lyα-emitting galaxies to assess the impact of neutral gas on the Lyα output of galaxies.
Methods. We observed the 21 cm line emission using the Karl G. Jansky Very Large Array in D-array configuration (∼55″ resolution, ∼38 kpc) for 37 star-forming galaxies with available Hubble Space Telescope (HST) Lyα imaging from the Lyman Alpha Reference Samples.
Results. We detected 21 cm emission for 33 out of the 37 galaxies observed. We found no significant correlation of global HI properties (including HI mass, column density, gas fraction, depletion time, line width, or velocity shift between HI and Lyα), with the Lyα luminosity, escape fractions, or equivalent widths (EW) derived with HST photometry. Additionally, both Lyα-emitters and weak or non-emitters are distributed evenly along the HI parameter space of optically selected z = 0 galaxies. Around 74% of the sample is undergoing galaxy interaction, this fraction is higher for Lyα-emitters (83% for galaxies with EW ≥ 20 Å) than for weak or non-emitters (70%). Nevertheless, galaxies identified as interacting have Lyα and HI properties statistically consistent with those of non-interacting galaxies.
Conclusions. Our results show that global HI properties (on scales > 30kpc) have little direct impact on the Lyα output from galaxies. Instead, HI likely regulates Lyα emission on small scales: statistical comparisons of Lyα and high angular resolution 21 cm observations are required to fully assess the role of HI in Lyα radiative transfer. While our study indicates that major and minor galaxy mergers could play a role in the emission of Lyα photons in the Local Universe, especially for galaxies with high HI fractions, the line of sight that a system is observed through ultimately determines the Lyα observables.
Key words: ISM: lines and bands / galaxies: interactions / galaxies: ISM / galaxies: starburst / radio lines: galaxies
© The Authors 2025
 Open Access article, published by EDP Sciences, under the terms of the Creative Commons Attribution License (https://creativecommons.org/licenses/by/4.0), which permits unrestricted use, distribution, and reproduction in any medium, provided the original work is properly cited.
This article is published in open access under the Subscribe to Open model. This email address is being protected from spambots. You need JavaScript enabled to view it. to support open access publication.
1. Introduction
The Lyman-α (Lyα, 2p→1s, λ = 1215.67 Å) line of hydrogen is a fundamental tracer of the physical processes occurring in galaxies. In star-forming galaxies, it is primarily produced during recombination of interstellar hydrogen after ionization by the Lyman continuum radiation from O and B stars. During hydrogen recombination, Lyα photons are emitted with a probability of 68% when assuming case B recombination (Dijkstra 2014), making Lyα the intrinsically strongest line emitted by galaxies. While the line is emitted in the rest-frame ultraviolet (UV), Lyα is redshifted to the optical range at z > 2 and the infrared at z ≳ 5, making it an excellent observational probe of the high-redshift Universe with current ground-based and space telescopes. Consequently, this emission line has enabled the discovery of several tens of thousands of galaxies through narrow-band imaging and spectroscopy (Ouchi et al. 2020; Mentuch Cooper et al. 2023). Furthermore, Lyα is an excellent tool for studying the Epoch of Reionization, an important cosmological epoch that saw the transition of the Universe from mostly neutral to predominantly ionized (e.g., Haiman & Spaans 1999; Stark et al. 2010; Konno et al. 2018).
However, the use of the Lyα line to extract information about galaxies is limited by the complex radiative transfer that Lyα photons undergo within the neutral interstellar medium (ISM). The line is resonant, undergoing spatial and spectral scattering in neutral hydrogen gas (HI) that modifies the line shape (Verhamme et al. 2006). Furthermore, dust within the interstellar medium absorbs Lyα photons. The probability of absorption by dust increases with the number of scattering events and, thus, with the column density of neutral gas. As a consequence, the Lyα output of galaxies is thought to strongly depend on the neutral gas content, geometry, and kinematics of galaxies (e.g., Giavalisco et al. 1996; Kunth et al. 1998; Mas-Hesse et al. 2003; Atek et al. 2009; Wofford et al. 2013; Östlin et al. 2021; Hayes et al. 2023). This also means that Lyα profiles could potentially be used to recover information about the neutral gas properties of individual galaxies and vice versa. Assessing the impact of the neutral interstellar medium on Lyα emission and answering the question of whether ISM properties can be recovered from Lyα profiles requires detailed comparisons between HI properties and the Lyα output of galaxies.
Most of the available information on the neutral interstellar medium of Lyα-emitting galaxies has been obtained through observations of low ionisation state (LIS) lines from metals (Savage & Sembach 1996; Shapley et al. 2003; Quider et al. 2009; Henry et al. 2015; Rivera-Thorsen et al. 2015; Jaskot et al. 2019; Reddy et al. 2022; Hayes et al. 2023; Parker et al. 2024). These absorption lines can be observed in the same spectra as Lyα, providing a very useful proxy for neutral gas column density, kinematics and covering fraction, at a limited observational cost. Studies using metal absorption lines have shown that outflows are necessary for Lyα escape from high neutral gas column density environments and Lyα emission is generally associated with low neutral gas covering fractions. These results indicate that HI column density, regulated by early time radiative and wind feedback, is likely a driver in the emission of Lyα photons. However, the use of LIS absorption lines presents a few drawbacks. These include the fact that LIS absorption lines trace neutral gas on small scales within the spectroscopic aperture. While these scales are the same as those where Lyα is measured, absorption lines only yield information on the gas directly in front of the source, when Lyα is expected to scatter in surrounding gas and on the back-side of continuum sources (Verhamme et al. 2006). Furthermore, many studies have pointed to the fact that metal absorption lines generally underestimate the neutral gas column density (Reddy et al. 2016; Gazagnes et al. 2018; Huberty et al. 2024) and the most commonly used lines, such as C II and SiII, are also found in hydrogen-ionized gas. For these reasons, LIS absorption lines from metals do not directly relate Lyα emission to the neutral gas content and distribution within galaxies. Lyman series absorption lines, such as Lyman-β or Lyman-γ, originate directly from neutral hydrogen. They have been used as a complement to LIS absorption lines in a handful of studies (Henry et al. 2015; Steidel et al. 2018; Gazagnes et al. 2020), mostly confirming the results obtained with metal absorption lines, but also demonstrating their limitations. Nevertheless, whether they originate from metals or hydrogen, absorption lines remain limited as means to characterize the HI content of Lyα-emitting galaxies. Similarly to metal lines, Lyman series absorption lines do not probe the full physical scale of neutral gas impacting Lyα radiative transfer, as they do not probe the medium behind and around UV continuum sources, which also affects the Lyα output of galaxies due to scattering of Lyα photons. A central question related to Lyα radiative transfer remains, namely, how the large-scale neutral gas reservoir of galaxies impacts Lyα emission.
The 21 cm line of hydrogen is one of the best tracers of neutral gas as it originates directly from neutral hydrogen, and allows for studies of the global HI content and kinematics of galaxies. However, it is faint and thus only observable in the very nearby Universe. The furthest direct detection of 21 cm emission from an individual galaxy has been done at z = 0.376 (Fernández et al. 2016), and 21 cm stacking measurements have included galaxies up to a higher redshift bound of z = 1.45 (Chowdhury et al. 2020). Efforts have been made to detect lensed 21 cm signal at higher redshifts, yielding one marginal detection at z = 0.407 (Blecher et al. 2019; Deane et al. 2024). In comparison, most of Lyα observations have been made above z = 2, where the Lyα line is redshifted enough to be observed by ground-based telescopes. Comparing 21 cm and Lyα emission in galaxies therefore requires UV observations in the nearby Universe, which can only be obtained from space.
The Lyman Alpha Reference Samples (LARS and eLARS, also referred to as (e)LARS in the rest of the manuscript, Östlin et al. 2014; Hayes et al. 2014; Melinder et al. 2023) have been assembled to provide detailed, resolved observations of Lyα emission from 42 local galaxies. Owing to a large coverage across wavelengths, these samples aim to provide a complete census of the galaxy and interstellar medium properties that drive Lyα emission. Notably, they are the only samples of Lyα-emitting galaxies with uniform 21 cm HI imaging. This makes the sample ideal to assess the link between the 21 cm and Lyα emission. A few 21 cm studies of Lyα-emitting galaxies have been conducted (e.g., Cannon et al. 2004; Kanekar et al. 2021; Le Reste et al. 2022; Purkayastha et al. 2022) and some even found tentative correlations between the properties of the neutral interstellar medium traced by the 21 cm line and Lyα properties (Pardy et al. 2014). However, until now, none had sufficiently large samples to assess the role of neutral gas on Lyα-emission in a statistically robust manner. Pardy et al. (2014) evaluated the impact of global neutral gas content through single dish observations of 14 galaxies in the original LARS sample, and low angular resolution interferometric observations for five galaxies using the Karl G. Jansky Very Large Array (VLA) in D-configuration. This study found tentative anti-correlations between the HI line width and the Lyα extension parameter (the ratio between Lyα and Hα Petrosian radii) and between the HI mass and both the Lyα escape fraction and equivalent width (EW). Furthermore, a qualitative multi-wavelength study of two galaxies with unprecedented high resolution 21 cm observations (3.5″ synthesized beam size) in the (e)LARS samples reported morphological similarities between Hα, Lyα and 21 cm emission (Le Reste et al. 2022). Both of these studies point towards the possible existence of scaling relations between 21 cm and Lyα properties. However, the samples these studies were conducted on contained few galaxies, limiting efforts to establish the general neutral gas properties of Lyα-emitters and investigate correlations between 21 cm HI and Lyα emission properties. Here, we present 21 cm VLA D-configuration observations of 37 galaxies in the LARS and eLARS samples. We aim to determine if Lyα-emitting galaxies belong to a different galaxy population than optically selected galaxies per their HI gas properties and quantify the impact of the neutral gas content and kinematics of galaxies on their Lyα emission output.
The paper is structured as follows. The methods, including the description of 21 cm observations, 21 cm data reduction scheme and derivation of Lyα and galaxy properties are presented in Sect. 2. Results on the 21 cm properties of Lyα-emitters, the impact of global HI properties on Lyα observables, and the role of galaxy interactions are presented in Sect. 3. We discuss the implications of these results for Lyα emission from galaxies in Sect. 4 and provide a summary and conclusion in Sect. 5.
Throughout this paper, we assume a standard ΛCDM cosmology with parameters H0 = 70 km s−1.Mpc−1, Ωm = 0.3, and ΩΛ = 0.7. Unless stated otherwise, redshifts and velocities follow the optical convention. We use the terminologies “neutral gas” and “neutral hydrogen gas” interchangeably to refer to neutral hydrogen gas.
2. Data and methods
2.1. VLA 21 cm data description and reduction
The LARS and eLARS galaxies were observed with the VLA1 in the D configuration as part of projects 13A-181 and 14A-077 (PI Cannon). All galaxies but LARS 10, 11, 12, 13, and 14 were observed. The observations made use of the L-band centered on the respective predicted 21 cm HI frequencies of the galaxies, based on optical redshifts. Information about the observations, including the integration time, percentage of flagged visibilities, sources used for calibration, beam parameters, and root mean square (rms) values can be found in Table A.1. Part of the D-configuration VLA 21 cm observations of the LARS and eLARS galaxies have been presented in previous studies (Pardy et al. 2014; Le Reste et al. 2022).
Data reduction followed standard prescriptions in the CASA 5.5.0 environment (CASA Team 2022). Only a fraction of the measurement sets was selected for data reduction using the task split: we kept 50% of channels centered around the theoretical 21 cm line frequency according to the optical redshift. In the frequency range considered, radio frequency interferences (RFIs) pose a significant problem, especially for compact array configurations. We adopted a two-step scheme to mask the visibilities impacted by RFIs. First, strong and narrow RFIs were removed automatically using the task tfcrop (maxnpieces = 3, timecutoff = 3.0, freqcutoff = 3.0), resulting in the flagging of 0–3% of the data for each measurement set. The remaining RFIs were removed with the flagdata task following visual inspection of the datasets. We report the fraction of visibilities that required flagging due to RFI contamination in Table A.1. The flagged measurement sets were then calibrated using the bandpass and phase calibrators listed in Table A.1. The measurement sets containing target galaxies and calibrators were split using the task split to keep only the visibilities corresponding to the target galaxies.
The calibrated measurement sets were continuum subtracted in the uv-plane by fitting a polynomial of order 1 on line-free channels for each individual dataset using the task uvcontsub. For each measurement set, visibilities were re-weighted according to their scatter using the task statwt on line-free channels. For the continuum subtraction and re-weighting, we typically used 100 line-free channels on each side of the line, separated from the edges of the line by at least 50 channels. The calibrated, continuum-subtracted datasets were cleaned to 0.5σ using the CASA task tclean. We used both the auto-multi-thresh algorithm (Kepley et al. 2020) and visual inspection to identify 21 cm emission regions in the cubes and define the regions where to apply the clean algorithm. Cleaning was performed with task tclean on the 21 cm emission regions identified in the cube, using a Briggs weighting robust parameter of 0.5. The clean images were set to have a common beam and the spectral channel width of the cubes was set to 5 km s−1 (using the radio velocity definition). We corrected for the primary beam with the task impbcor and produced cubes using the optical velocity definition.
Finally, we used the 21 cm Source Finding Application (SoFIA 2, Serra et al. 2015; Westmeier et al. 2021) on the non-primary beam corrected cubes to identify the regions containing emission for subsequent analysis. The S+C algorithm was run with a threshold of 4.0σ, spatial smoothing kernels of 0, 3, 5, 10, and 15 pixels, and spectral smoothing kernels of 0, 3, 5, and 11 spaxels. We used a reliability threshold of 0.95 to improve the reliability of detections. The mask produced by SoFIA 2 was applied to the primary beam corrected images in order to recover accurate flux density values. We used the SoFIA Image Pipeline (Hess et al. 2022) to inspect and validate the HI detections made by SoFIA 2.
2.2. H I properties and data products
A major limitation to comparing data observed at 21 cm and in the UV is the drastic difference in both the fields of view and resolutions reached by observations. The average synthesized beam size of the VLA D 21 cm cubes in our sample is 55 arcseconds, corresponding to an average 38 kpc scale covered in physical units (see Table A.1). Meanwhile, the Hubble Space Telescope (HST) data used to extract Lyα properties have much higher resolution (0.04″ per pixel) and the fields of view of HST images are significantly smaller than those in 21 cm images. The average aperture diameter to extract the Lyα properties used in this paper is 9.4 kpc (Melinder et al. 2023), about four times smaller than the average scale reached by the VLA synthesized beam. To alleviate the scale discrepancy between UV and radio observations, we provide measurements of the HI properties of the LARS and eLARS galaxies in two different apertures. The first set of 21 cm measurements was extracted from a synthesized beam-shaped aperture centered on the coordinates of the target galaxy (see Table A.2). This is the physically smallest unit of information that can be recovered from the 21 cm cubes and is used when comparing Lyα and 21 cm HI properties. Despite this effort to improve the match between Lyα and 21 cm extraction apertures, the beam-extracted 21 cm emission is still extracted in more that four times the diameter of the aperture used for Lyα photometry. The second set of measurements we provide is the total 21 cm extraction obtained from the SoFIA 2 mask. We note that this total measurement encompasses all the diffuse and extended HI emission, as well as the emission coming from objects interacting with the (e)LARS galaxies in some cases. Therefore, the total extracted 21 cm is not as relevant for Lyα visibility as compared to the 21 cm emission extracted in the beam. We used the total measurement to assess the general 21 cm properties of the galaxies in the sample. In particular, we compared the total HI masses and gas fraction to those of galaxies in the Local Universe observed with single dish telescopes.
We have derived several data products to characterize the properties of the 21 cm emission in the LARS and eLARS galaxies. The products and methodology used to derive these are described below. Prior to deriving 21 cm flux and spectra, the intensities measured in Jy/beam were converted to Jy through multiplication by bf = (4 ln2 lpix2)/(π bminbmaj), with lpix the pixel length, bmin the minor beam axis and bmaj the major beam axis in arcseconds.
Integrated 21 cm emission map. We produce moment 0 maps by integrating the 21 cm data across the spectral dimension:
with Δv the channel width in km s−1.
HI column density map. From the integrated emission maps M0 in Jy beam−1 km s−1, we derive column density NHI maps in atoms per cm2, assuming the HI line is optically thin, with bmin, and bmaj in arcseconds:
HI velocity centroid map. We produce moment 1 maps that indicate the line centroid per pixel:
HI linewidth map. The linewidth maps are calculated by deriving the full width half maximum of the line for each pixel in the following way:
For both the moment-1 and linewidth maps, we applied a signal-to-noise (S/N) constraint to only show values with S/N > 5. We note that we only used positive pixels to generate the linewidth maps, due to the presence of pixels with negative values away from the line center in multiple datasets. Since pixels away from the line center have larger weights, negative pixels lead to invalid values in the square root and, thus, incomplete linewidth maps.
21 cm spectra. We extracted two spectra for each galaxy: one from the SoFIA-masked data and one from a beam-sized aperture applied to the SoFIA-masked data. We also show values outside the mask, using either the beam size for the beam extraction or a circular mask with the average size of the SoFIA mask in the spectral direction. The noise is estimated as the rms per channel from regions outside of the SoFIA mask, taking into account the number of pixels in the mask per channel Nv, and a bandpass calibrator error of 3%, such that  .
.
21 cm flux. The HI flux is calculated by summing all the pixels within the detection mask, using the optically thin regime assumption:
The error on the flux is derived in a similar way as the error on the spectra:  . We provide upper limits for the galaxies that were not detected, using the median HI linewidth within the beam and total extraction (respectively 154 and 156 km/s) and the 1σ flux limit measured through the rms noise in the image.
Neutral gas mass. The HI mass in units of M⊙ is derived from the integrated 21 cm flux using the HI mass equation (see e.g., Roberts & Haynes 1994), with the luminosity distance D in Mpc, and the HI flux SHI in Jy km s−1:
The error on the mass is derived taking into account the HI flux error.
HI velocity and redshift. The HI velocities quoted for the beam and total extraction are derived by calculating the centroid within the detection mask vHI = ∑vv Iv/(∑vIv), the error is calculated via  ).
).
21 cm line profile width. To derive the linewidth, we fit the HI line profile with Gaussian profiles. For each galaxy, we visually examined the fit to the profiles with one, two, and three Gaussian components and selected the fitting function yielding the best fit to the edges of the line profile. For most galaxies, we used profiles with two Gaussian components, however, for a few objects these provide a poor fit. Therefore, we used a single Gaussian fit for LARS07, eLARS01 and eLARS28. For LARS06, eLARS03, eLARS05, and eLARS10, we used three Gaussian components to fit the spectra. We then measure the velocity corresponding to half the fitted peak value on each end of the profile to calculate the HI line width W50. The resulting velocity bounds used to calculate W50 for each galaxy are indicated by dashed vertical lines in the bottom panel of Fig. 1 for eLARS04 and in the figures available on Zenodo for the other galaxies (see the section on data availability).
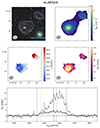 |
Fig. 1. 21 cm maps and spectra of eLARS04. The field of view has been adapted to show the full extent of the main SoFIA 2 detection. Top left: DECaLS optical composite image with HI column density contours at level 1.0 × 2n × 1019 cm−2, with n = 0, 1, 2, …, 5 overlaid. The blue solid line shows the regions with S/N > 3. Contours fully included in the S/N ≥ 3 mask are shown in white, low signal-to-noise contours are shown in gray. A gray cross indicates the position of the galaxy according to optical coordinates, a synthesized beam shaped aperture centred on these coordinates was used to extract HI properties in the center. Top right: Column density map with the same contours as on the previous panel overlaid. Middle left: Moment-1 map. Middle right: Linewidth map. Bottom: Total 21 cm spectrum (gray) and beam-extracted 21 cm spectrum (black). Velocity centroids are indicated by a vertical solid line, and velocity at half width on either side of the peaks by dashed lines, in either gray or black for the total or beam extraction respectively. |
2.3. Lyα and galaxy properties
We compare three Lyα observables to HI properties derived from 21 cm measurements: the Lyα luminosity, equivalent width, and escape fraction. These observables are extracted from continuum-subtracted HST photometry, with the values presented in Melinder et al. (2023) and listed in Table A.2 of the present paper. The offset of Lyα peak emission on the red-side of the line as compared to systemic velocity,  , has been measured in the 2.5″ Cosmic Origins Spectrograph (COS) aperture, centered on the brightest FUV pixel for all (e)LARS galaxies (see Rivera-Thorsen et al. 2015 for a description of the observations for LARS). The algorithm used to calculate
  is described in Runnholm et al. (2021), we list the values in Table A.2. Note that Lyα detection in HST imaging does not necessarily imply detection within the COS aperture, and vice versa. We used the Lyα equivalent width to separate between galaxies formally considered as Lyα-emitters using the canonical EW ≥ 20 Å value (see e.g., Ouchi et al. 2020), and weak and non-emitters with EW < 20 Å. We also retrieved redshifts computed through fitting of nebular emission lines from Sloan Digital Sky Survey (SDSS) spectra (Melinder et al. 2023). We then used the redshifts to calculate the luminosity distance to (e)LARS galaxies.
In addition to comparing HI and Lyα observables, we compare the HI properties of LARS galaxies to those of optically selected galaxies at z = 0 in the ALFALFA-SDSS Galaxy Catalog (Durbala et al. 2020). This catalog contains measurements of the HI content obtained with the Arecibo telescope (∼3.6′ beam) as part of the Arecibo Legacy Fast ALFA (ALFALFA) survey (Haynes et al. 2018) for 30 000 SDSS galaxies. To enable comparisons between the two samples, we need stellar mass and star formation rate properties for the (e)LARS galaxies consistent with those in the ALFALFA-SDSS Galaxy Catalog. We use the stellar masses and SFRs derived through a spectral energy distribution (SED) fitting to the UV, optical, and IR data from the GALEX-SDSS-WISE Legacy Catalog (GSWLC Salim et al. 2016), with the values listed in Table A.2. Seven (e)LARS galaxies do not have available stellar masses and SFRs in GSWLC. For those objects, we estimated GSWLC values using a fit to the masses and SFRs presented in Melinder et al. (2023), obtained from the SDSS DR8 MPA-JHU catalog (Brinchmann et al. 2004; Salim et al. 2007); hereafter, these are referred to as SDSS measurements. For galaxies with available GSWLC measurements, the SDSS and GSWLC measurements are in good agreement. Thus, we fit the available SDSS measurements to predict the GSWLC masses and SFRs for objects with only SDSS measurements available (see Appendix C) and we report the predicted values in Table A.2.
2.4. Galaxy interaction identification
The majority of LARS galaxies were classified as mergers in Guaita et al. (2015) and Micheva et al. (2018). Additionally, Le Reste et al. (2022) concluded that the neutral gas disturbance caused by the merger interactions in LARS08 and eLARS01 was likely facilitating Lyα escape from the galaxies. Upon our inspection of the 21 cm maps, we noticed the presence of morphological features indicative of galaxy interaction in a significant number of (e)LARS galaxies. Since neutral gas is less gravitationally bound than stars in galaxies, the imaging of the 21 cm line in emission has long been recognised as a tool to help identify and characterize galaxy interactions (see e.g., Holwerda et al. 2011). To assess the potential impact of galaxy interactions on the emission of Lyα, we have identified galaxies that can be classified as gravitationally interacting using the following criteria.
-
Close pairs. We searched for close companions to the (e)LARS galaxies with available SDSS spectroscopy. We applied the close-pair criterion on projected proper distance Δr and rest-frame velocity offset Δv as defined in Ventou et al. (2019): Δr ≤ 50 kpc & Δv ≤ 300 km s−1. or 50 ≤ Δr ≤ 100 kpc & Δv ≤ 100 km s−1.
-
Morphology. Not all galaxy mergers have companions and some may have companions that are too close for their spectra to be observed in SDSS due to fiber collision. This especially impacts mergers close to nuclear coalescence, where the merger-driven increase in star formation and gas displacement is likely to be the largest. For this reason, we also considered galaxies showing morphologies characteristic of merger interaction. Specifically, we looked for disturbed morphologies indicative of galaxy interaction, such as tidal tails, or merging nuclei. We inspected RGB composites from HST imaging presented in Melinder et al. (2023) and Dark Energy Camera Legacy Survey (DECaLS) imaging (Dey et al. 2019) for such morphological features. The DECaLS RGB composites are shown in Figure 2. We also inspected the HI images for morphologies resulting from interactions, including HI envelopes linking several objects or showing tidal components.
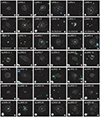
Fig. 2. DECaLS optical g, r, and z band color-composite images of galaxies in the LARS and eLARS samples with HI 21 cm column density contours overlaid. The contours have fixed levels of 2n × 1019 cm−2, with n = 0, 1, 2, …, 5. White contours have S/N ≥ 3, while the low signal-to-noise contours are shown in gray. All images are 300 × 300 kpc2, and are centered upon the coordinates of the galaxies. The contours show the main SoFIA 2 detection, apart from eLARS05 and eLARS10 for which an ancillary detection is shown in grey to the south east. A star on the lower right corner of a panel indicates the galaxy has been identified as undergoing interaction.
-
Kinematics. Finally, we included galaxies that were classified as having Hα kinematics strongly deviating from a rotating disk in Herenz et al. (2024). Most galaxies classified as interacting based on their optical and HI morphology fall in this category, with the exception of eLARS13. This galaxy exhibits disturbed Hα kinematics, but has no companion identified spectroscopically and it is too compact to be identified through morphological features.
We list the galaxies identified as interacting and the methods used for identification for each galaxy in Table 1, as well as the merger fraction for the different identification methods for all galaxies and for the subsets classified as Lyα-emitters and non or weak emitters. We use star-shaped markers in Fig. 2 to indicate galaxies identified as interacting.
Galaxies identified as gravitationally interacting with a companion in the (e)LARS samples.
3. Results
3.1. 21 cm properties of LARS and eLARS galaxies
We detected 33 of the 37 LARS and eLARS galaxies observed in 21 cm with the VLA D-configuration array. Galaxies detected in 21 cm in the (e)LARS samples have an average HI mass of MHI = 6.58 × 10⁹ M⊙, an average HI column density of NHI = 4.24 × 1019 cm−2, and and average 21 cm line width of W50 = 215 km s−1. The galaxies that were not detected in 21 cm with the VLA in D configuration are LARS05, eLARS13, eLARS19, and eLARS20, two of which are Lyα-emitters (EW ≥ 20 Å). The HI properties of LARS and eLARS galaxies are presented in Table A.3. An overview of the HI emission maps for the sample is shown on Fig. 2, where fixed HI column density contours are overlaid on DECaLS (Dey et al. 2019) optical composite images of LARS and eLARS galaxies. To facilitate the comparison between galaxies, all panels have the same physical scale of 300 × 300 kpc2. We present moment maps and spectra of each galaxy on separate figures, with an example for eLARS04 shown on Fig. 1. The moment maps and spectra for the rest of the sample are available on Zenodo. In these figures, the field of view has been tailored to show the full extent of the main SoFIA 2 detection. We use a cross to indicate the coordinates of the galaxies, which are the locations around which the beam aperture was centered to extract the HI properties on smaller scales.
We compare the total HI properties in the (e)LARS samples to those of optically-selected galaxies in the Local Universe from the ALFALFA-SDSS Galaxy Catalog that were observed with the Arecibo telescope (∼3.6′ beam, corresponding to physical scales between 80 and 200 kpc for (e)LARS galaxies observed in HI) in Fig. 3. The position of the galaxies as compared to ALFALFA-SDSS galaxies, and to the z = 0 star-forming main sequence (SFMS, Speagle et al. 2014) is presented in the star formation rate (SFR) to stellar mass diagram in the top-left panel. The (e)LARS galaxies were selected based on requirements on their Hα equivalent width and FUV magnitude; for this reason, they have higher SFRs for a given stellar mass than the bulk of z = 0 galaxies. Lyα-emitters tend to have larger SFRs at a given stellar mass than weak and non-emitters, although there is ample overlap in the SFR-M* parameter space between Lyα-emitters and non or weak emitters. The top-right panel shows the HI mass as a function of stellar mass: (e)LARS galaxies are distributed around the median relation for ALFALFA-SDSS galaxies. One object, LARS06 has an extremely large HI mass for its stellar mass and is offset from the rest of the sample and from the ALFALFA-SDSS galaxies (see also Pardy et al. 2014). As can be seen in the online figure presenting moment maps for this galaxy, LARS06 is a dwarf galaxy being accreted onto the HI envelope of the massive spiral galaxy UGC 10028. This explains the offset in HI properties. Looking at the median HI mass in stellar mass bins for Lyα emitters, they have similar HI masses for a given stellar mass as ALFALFA-SDSS galaxies. Weak and non-Lyα-emitters have a slightly higher HI mass per stellar mass above M∗ ≥ 109.5 M⊙, but the median value in all stellar mass bins with sufficient data is in agreement with that of the ALFALFA-SDSS galaxies and that of the Lyα emitters. This indicates that Lyα-emitters have a similar HI mass for a given stellar mass as non-emitters as well as the bulk of optically selected galaxies in the local Universe. A similar picture emerges from the lower left panel presenting the HI fraction, fHI = MHI/M*, as a function of stellar mass.
Finally, the bottom right panel shows the offset from the SFMS sequence,  , as a function of HI mass, using the SFMS relation presented in Speagle et al. (2014) at z = 0 to derive the offset. As can be expected from the position of the (e)LARS galaxies in the SFR-M* and MHI–M* diagrams, (e)LARS galaxies have a larger offset from the SFMS for a given HI mass than the bulk of SDSS-ALFALFA galaxies. While the medians for Lyα-emitters and weak or non-emitters are close, the Lyα-emitters tend to have a slightly higher offset from the main sequence at a given HI mass. This suggests that at a fixed stellar and HI mass, Lyα-emitters tend to have a larger SFR than weak or non-emitters and than the bulk of optically selected galaxies at z = 0. Nevertheless, the ΔMS − MHI parameter spaces sampled by Lyα-emitters and weak or non-emitters overlap.
To determine whether the high Lyα EW sample and the weak and non-emitters are statistically different in terms of any of the properties presented in Fig. 3, we performed sets of Kolmogorov-Smirnov (K–S) tests. We also compared the properties of Lyα-emitters to those of galaxies in the SDSS-ALFALFA sample to assess whether Lyα-emitters are statistically different from the general z = 0 population. We used the K-S test implementation kstest in the Python module scipy and require a p-value p < 0.003 to reject the null-hypothesis that two samples are drawn from the same distribution. The results of the K-S tests can be found in Table 2. We find that Lyα-emitters and weak and non-emitters are statistically consistent in terms of all properties tested, with K-S test p-values ranging from 0.08 to 0.72. These properties include the stellar mass, star formation rate, offset to the main sequence, HI mass, and HI fraction. Additionally, we find that Lyα-emitters have properties that are consistent with the general z = 0 population; specifically: their stellar mass, HI mass, and HI fraction (p ≥ 0.16). Lyα-emitters in (e)LARS samples distinguish themselves from the rest of the z = 0 galaxy population in terms of their SFR (p = 1.4e–4) and their offset to the SFMS (p = 8.6e–11). However, running K-S tests on these properties between weak and non-emitters and the SDSS-ALFALFA sample leads to similar results, with p = 1.6e–5 for the SFR and p = 3.5e–12 for the offset to the main sequence. This indicates that the difference likely stems from sample selection, rather than from star formation-related properties setting Lyα-emitters apart.
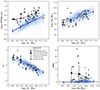 |
Fig. 3. HI properties and galaxy properties for the (e)LARS sample and optically-selected galaxies from SDSS-ALFALFA (Durbala et al. 2020). In all panels, we split the (e)LARS sample between objects considered Lyα emitters (EWLyα ≥ 20 Å, in black) and weak and non-emitters (EWLyα < 20 Å, in gray). The SDSS/ALFALFA galaxies are shown in blue. Squares indicate the median in stellar mass or HI mass bins, blue squares show the median for the SDSS/ALFALFA galaxies, black squares the median for the (e)LARS Lyα-emitters, and gray squares the median for the weak and non Lyα-emitters. The error bars associated with the median points show the standard deviation within a given mass bin. In the top-left panel, the solid black line shows the SFMS at z = 0 (Speagle et al. 2014). |
Results of the K-S tests run to assess whether different samples considered in this manuscript are statistically different in terms of their observables.
Interferometers typically underestimate the global HI content of galaxies due to the lack of short-spacing data in the uv-plane. Our galaxies are at an average redshift of ∼0.045, making their HI angular extent compact (≲4′) and alleviating the short-spacing issue as compared to very nearby galaxies. Nevertheless, we have sought to verify whether the VLA measurements are missing a fraction of the HI mass in the form of extended emission. To do so, we compared our HI masses with the 21 cm LARS measurement from Pardy et al. (2014) using the Robert C. Byrd Green Bank Telescope (GBT). Our measurements are either in agreement with or higher than the GBT values. We also measured higher HI fluxes and masses compared to the values derived for galaxies that had VLA observations available in Pardy et al. (2014). The difference in estimated mass values is likely due to a combination of several factors, including difference in emission detection (SoFIA 2 using S+C algorithm with large spatial and spectral kernels VS visual detection favoring only high-surface-brightness emission), HI flux estimation methods (summation in the detection mask VS profile fitting), and zero-flux offset. In Appendix B we present a comparison of our mass estimations for three galaxies to those obtained from imaging in the Apertif survey Adams et al. (2022, preliminary data obtained through private communication with K. M. Hess), a wide-field HI survey targeting the northern-hemisphere sky. Our estimations are in agreement with the Apertif values within 2.5σ for all objects; thus, we consider our HI estimates to be robust. One LARS galaxy, namely, LARS08, has HI measurements available in the ALFALFA-SDSS sample. The HI mass measured in ALFALFA for LARS08 is MHI, ALFALFA = 2.04 ± 0.25 × 10¹⁰ M⊙, in agreement within error bars with our measurement of MHI, t = 1.62 ± 0.20 × 10¹⁰ M⊙. We conclude that the fraction of extended flux missed by the interferometer is thus likely to be negligible.
3.2. Comparing 21 cm and Lyα emission
We have established that galaxies in the (e)LARS samples have neutral gas properties similar to those of optically-selected galaxies in the local Universe, and that Lyα-emitters cover a parameter space similar to that of weak and non-emitters. We now look at the impact of 21 cm properties extracted in the beam on Lyα observables, and in particular on the Lyα luminosity, EW and escape fraction. In Fig. 4 we present scatter plots of various HI properties characterizing the content and kinematics of neutral gas in the (e)LARS galaxies as a function of Lyα observables. In particular, we compare the Lyα properties to the HI mass, HI fraction, HI depletion time τdep, HI = MHI/SFR, the HI line width, W50, the offset between the Lyα red peak velocity and the HI velocity centroid, and the average HI column density. For each scatter plot, we show on the top left corner the Kendall τ parameter, p-value, and sample size that characterize the degree of correlation between Lyα and HI variables. The Kendall τ and p-value presented here were calculated following the methodology developed in Isobe et al. (1986), that takes into account variable sets with upper limits. Additionally, errors on the Kendall τ parameter due to the uncertainties on variables were calculated using a Monte Carlo framework similar to that in Curran (2014). The code2 used for the calculation of the generalised Kendall τ parameter was first described and applied in Herenz et al. (2024) to assess the degree of correlation between ionized gas and Lyα observables for LARS and eLARS galaxies. To estimate the errors associated with the τ parameter values, we run 104 Monte-Carlo simulations for each sets of variables presented in Fig. 4. As in Melinder et al. (2023), we considered a correlation/anti-correlation is significant if p ≤ 0.003. Given p ≤ 0.003 and the sample sizes N = {37, 33, 17} considered here, following the approach in Herenz et al. (2024), there is a requirement on |τ|> {0.34, 0.36, 0.53}, respectively, for the different samples considered. Specifically, if p > 0.003, we cannot confidently reject the null hypothesis, which states that the two variables being tested are not associated. If p > 0.003 and |τ| is above any of the specific thresholds for a given sample size, there is a non-negligible probability that the strong correlation between two variables is due to chance. Instead, if p ≤ 0.003 and |τ| is below a given threshold, we can confidently state that the correlation between the two variables tested is extremely weak. As can be seen from the p-values shown in Fig. 4, with p > 0.007, none of the HI properties we measure is robustly correlated with any of the Lyα observables presented here.
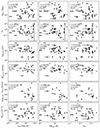 |
Fig. 4. HI properties extracted in the synthesized beam-shaped aperture as a function of Lyα observables. From left to right, the x-axis shows the Lyα luminosity, Lyα equivalent width and Lyα escape fraction. From top to bottom, the y-axis shows the HI mass, the HI gas to stellar mass fraction, the HI mass per unit star formation rate, HI linewidth, and offset between Lyα red peak and HI centroid velocity. Generalized Kendall τ, p-values and sample sizes associated with each scatter plot are shown on the top left corner of each panel. |
We then further tried adding a third variable by color-coding the plots, such as the dust extinction E(B–V), which is anti-correlated with the Lyα escape fraction (Melinder et al. 2023), or the gas-phase metallicity, but no clear trends emerged from such scatter plots either. The global Lyα emission observables thus appear to be mostly independent of the properties of the HI gas reservoir in a galaxy.
3.3. The impact of mergers on H I and Lyα emission
A large fraction of (e)LARS galaxies show disturbed HI envelopes, sometimes encompassing one or several companion objects. Several 21 cm ancillary detections were made in the LARS and eLARS fields, some of them in close spatial and spectral proximity to galaxies in our sample (see, e.g., the object south-east of eLARS05 and 10 in Fig. 2). A few galaxies are interacting with massive, HI-rich spirals in their vicinity. This is the case for LARS06 in particular, which is found a few kpc away from UGC 10028, embedded within the neutral gas envelope of this galaxy (see online figure with moment maps for LARS06). While the 21 cm measurements of objects with HI-rich companions do not characterize the neutral gas content of the targets only, they still probe the neutral gas environment that is relevant to Lyα escape. Therefore, we have chosen to keep these objects in the study. However, we note that since LARS06 is a Lyα absorber, it is not included in correlation analysis on the impact of HI properties on Lyα emission.
In Table 1, we have identified galaxies considered as gravitationally interacting via spectroscopic close-pair search and visual identification using their optical and HI maps. We find that 74% of galaxies in the (e)LARS sample are gravitationally interacting with companion galaxies. This fraction slightly higher for Lyα-emitters (83%) than for weak or non-emitters (70%). Notably, a larger fraction of Lyα-emitters show disturbed morphologies due to the interaction in the optical (50% for Lyα-emitters, 33% for weak and non-emitters). The fraction of galaxies identified as interacting through their HI morphology is much larger for Lyα-emitters (63%) as compared to weak or non-emitters (32%). This indicates that the merger-driven disruption of a galaxy’s neutral gas envelope could increase the probability of a galaxy emitting strongly in Lyα.
To further explore the impact of mergers on the HI and Lyα properties of (e)LARS galaxies, we show in Fig. 5, the galaxies identified as interacting via their morphology for Lyα-emitters and weak or non-emitters on the MHI − M* diagram. This figure is similar to that presented in the top right panel of Fig. 3, but highlights the position of Lyα-emitting mergers on the parameter space. The top panel of Fig. 5 shows that interacting Lyα-emitters are found across the HI mass parameter space of the z = 0 populations, with several interacting Lyα-emitters having a larger HI mass than most of the z = 0 at a similar stellar mass. Interestingly, non-interacting Lyα-emitters have either significantly lower HI masses for their stellar mass as compared to the bulk of z = 0 galaxies or they are non-detections in HI. This could suggest two possible modes for Lyα-emission: one where Lyα emission occurs in high HI mass galaxies, with mergers facilitating the emission, and another in the low HI-mass regime, where Lyα can escape without the need for merger interaction. Looking at the bottom panel of Fig. 5, we can observe that mergers and low HI-mass galaxies are not always strong Lyα-emitters. We conducted K-S tests to determine if galaxy interaction significantly impacts the Lyα properties of galaxies in (e)LARS samples. The p-values for the different properties tested in the interacting and non-interacting (e)LARS samples are presented in Table 2. We find that galaxies in (e)LARS identified as interacting have Lyα, galaxy, and HI properties that are statistically consistent with those of non-interacting galaxies (p ≥ 0.03, when p < 0.003 is required for the two samples to be considered as statistically different). This also applies to galaxies identified only through HI morphologies characteristic of merger-interaction, which have properties that are consistent with those of galaxies not identified as mergers through this method (p ≥ 0.06 for all properties tested). From these results, we hypothesize that certain processes or properties, such as an ongoing merger interaction or a low-HI mass, might facilitate the emission of Lyα from galaxies. Nevertheless, the geometry of the HI reservoir and the small-scale HI distribution around a star-forming region are crucial to the emission of Lyα photons. The observation of Lyα-emission from a system thus likely depends on the line-of-sight observed; additionally, for mergers, it may also depend on the mass ratio of the two galaxies and timescale of the merger interaction.
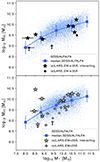 |
Fig. 5. HI mass as a function of the stellar mass for SDSS/ALFALFA galaxies (in blue) and (e)LARS galaxies for objects classified as interacting and non-interacting. We show the position of Lyα-emitters with EWLyα > 20 Å on the top panel and weak or non-emitters on the bottom panel. The square blue markers show the median in bins of stellar mass for SDSS/ALFALFA galaxies. Circles indicate galaxies not identified as undergoing gravitational interaction, while stars show the objects classified as interacting. Only galaxies observed in 21 cm are shown here. |
4. Discussion
4.1. The impact of the global neutral gas content on Lyα emission
In this work, we present the HI properties of local Lyα-emitting galaxies and assessed whether HI properties impact the Lyα output of galaxies. We found no significant correlation between global HI properties and Lyα luminosity, equivalent widths, and escape fractions. Additionally, the global HI properties of Lyα-emitting galaxies (EW ≥ 20 Å) are similar to those of optically-selected z = 0 galaxies, and Lyα-emitters occupy a very similar parameter space in terms of HI content as weak and non Lyα-emitters. From these results, we have concluded that Lyα-emitting galaxies do not constitute a separate galaxy population as per their neutral gas properties. We note that the HI properties presented here are calculated in large apertures (∼40 kpc), as compared to Lyα properties measured in HST imaging. This suggests that if there is any dependence between Lyα and HI properties, it is found at the local level, on similar physical scales as those characterizing Lyα emission. The resolved neutral gas maps presented in Le Reste et al. (2022) for LARS08 and eLARS01 also support this argument: for example, eLARS01 has the second largest HI mass of the (e)LARS sample (MHI = 1.67 ± 0.22 × 10¹⁰ M⊙), yet it is a strong Lyα emitter, with EW = 21.2 Å. This can be explained by the geometry of the HI around the Lyα-emitting regions, with most of the HI mass being offset from the regions where Lyα emission has the highest luminosity, equivalent width, and escape fraction. Statistical measures of the HI content and geometry of Lyα-emitters on scales below 30 kpc will be important to firmly establishing the role neutral gas properties play into the emission of Lyα from galaxies.
4.2. Large scale environment and mergers
Numerous galaxies in the original LARS sample were known to be mergers due to clear signs of interaction in the optical (Guaita et al. 2015; Micheva et al. 2018). However, the eLARS sample has been selected with lower specific star formation rate requirements, along with an aim to cover a wider range in FUV luminosities and morphologies. This resulted in an increase of apparently normal star-forming disk galaxies compared to the original sample. Despite the difference in sample selection, a large fraction of the eLARS galaxies also have neutral gas distributions characteristic of interacting galaxies. This includes galaxies showing very regular morphologies in the optical, such as eLARS05 and eLARS10, which appear to share a common HI envelope. Out of all (e)LARS galaxies observed, 74% display clear evidence of ongoing galaxy interaction in their optical or HI morphology – or via the presence of a close companion confirmed spectroscopically. This is not completely surprising, as galaxies above the main sequence in the Local Universe are known to show signs of dynamical disturbances linked to interaction, with systems ranging from major mergers to galaxies with a close companion. Galaxy interactions typically cause an increase in the availability of gas and the efficiency with which neutral gas is converted into molecular gas – and, ultimately, into stars (Solomon & Sage 1988).
Interestingly, the subsample of galaxies formally considered as Lyα-emitters through their high equivalent widths have a higher interacting fraction (83%) than weak or non-emitters (70%). When looking more closely at the method used to characterize interacting galaxies, we find that a much larger fraction of Lyα-emitters present HI morphological features characteristic of interactions (63% as compared to 32% for weak and non-emitters) and, to a lesser extent, optical merger morphology (50% for Lyα-emitters, and 33% for weak and non-emitters). Similarly, a larger fraction of Lyα-emitters show signs of interaction through disturbed Hα kinematics (33%) than the weak and non-emitters (23%). Additionally, Lyα-emitters identified as interacting are found to be spread across the HI parameter space and some are even above the median MHI − M* relation at z = 0, while non-interacting Lyα-emitters have significantly lower HI mass than z = 0 galaxies. Together, these results suggest that merger interactions could play a role in the emission of Lyα photons from star-forming galaxies through the disruption of the neutral gas envelope. This process could be more important for Lyα emission in objects with high HI gas fractions. In low HI mass galaxies however, although interaction might help Lyα emission production and escape, other mechanisms such as stellar feedback could be sufficient to produce the conditions required for the emission and escape of Lyα radiation. However, a merger interaction or low HI mass does not necessarily guarantee the observability of Lyα with large EW, as a large fraction of interacting and low HI mass galaxies are found amongst the weak and non Lyα-emitters. This might be due to the angle at which we are seeing a galaxy, which is especially relevant for mergers since interactions typically result in anisotropic and asymmetric neutral gas geometry. Therefore, while galaxy interactions might increase the production of Lyα in galaxies through enhanced star formation, the escape of this radiation does not necessarily take place on our line of sight. Alternatively, Lyα emission might depend on the timescale of the interaction. Peak starburst activity typically occurs at nuclear coalescence, in the later stages of mergers (Georgakakis et al. 2000). Therefore, late-stage mergers would likely have turned a larger fraction of their gas into new stars, increasing both the intrinsic production of Lyα and Lyα escape by lowering the neutral gas fraction. The fact that a larger proportion of Lyα-emitters have been identified as interacting via optical and HI morphological features, as opposed to close pairs for weak and non Lyα-emitters, supports that argument.
Our study is not the first to point out the role of galaxy interaction on Lyα emission. The role of mergers as a general mechanism for Lyα emission from galaxies has been explicitly suggested both in the low- and high-redshift Universe (e.g., Hayes et al. 2005; Cooke et al. 2010). In Cooke et al. (2010), a relation was found between Lyα emission and galaxy pair separation in galaxies selected using the Lyman Break technique at z > 3. However, a blind spectroscopic study of 28 Lyman Alpha Emitters in the HETDEX pilot survey was not able to replicate this result (Hagen et al. 2016). This result was interpreted as coming from selection effects in Cooke et al. (2010) in the context of Lyman Break Galaxies, which are biased towards massive systems and could require interaction for Lyα emission. Observations of Lyα in ultraluminous infrared galaxies (uLIRGs) have also shown a high detection rate of Lyα emission originating (suprisingly) from extremely massive dusty mergers (Martin et al. 2015). Several 21 cm observations of other Lyα-emitting galaxies have shown the neutral gas of these objects to be strongly disturbed by merger interactions (Cannon et al. 2004; Purkayastha et al. 2022; Le Reste et al. 2024; Dutta et al. 2024). Mergers often lead to higher star formation rate density and are thus linked to Lyα emission through an increase in intrinsic UV production and stronger feedback. However, the gas could be playing another role than simply feeding star formation in an efficient manner. The offset or perturbed neutral gas geometries caused by mergers have been suggested as key in the escape of Lyα and even Lyman continuum emission by some 21 cm studies (Le Reste et al. 2022; Purkayastha et al. 2022; Le Reste et al. 2024). Finally, recent James Webb Space Telescope observations, combined with hydrodynamical simulations, have suggested galaxy mergers could also facilitate Lyα emission from galaxies into the Epoch of Reionization (Witten et al. 2024). Whether mergers play a role through their impact on the interstellar medium geometry, kinematics, or simply by increasing the star formation rate, our study indicates that they could be an important process for Lyα production and escape in the Local Universe. A detailed analysis of the impact of mergers on neutral gas geometry and Lyα will be presented in subsequent work, using higher angular resolution data (VLA C-array).
4.3. Caveats
One of the major caveats to our study is the mismatch between the scales on which HI and Lyα are observed, despite the use of a synthesized beam-shaped aperture to reduce the scale discrepancy. Indeed, 20 of the 45 galaxies studied in Melinder et al. (2023) show Lyα emission at the edge of the detector, thus, several of the Lyα quantities we use here are actually lower limits or estimates to the global Lyα properties. The larger scales probed by our 21 cm observations are likely to overestimate the HI properties corresponding to a given set of Lyα properties estimated from photometry. Since the difference in angular scales probed by the VLA varies from galaxy to galaxy and the HI distribution is not uniform, interpolating the HI quantities observed to the scales on which Lyα properties as measured is not possible. However, this aperture difference certainly increases the scatter when comparing Lyα and HI. Comparative studies of Lyα and 21 cm emission on smaller physical scales would alleviate the issue.
5. Conclusion
We present the 21 cm HI properties of Lyα-emitting galaxies in the Lyman Alpha Reference Samples. We detected 21 cm emission from 33 of the 37 galaxies observed with the VLA in D-configuration (∼55″ synthesized beam size). A majority of (e)LARS galaxies exhibit disturbed neutral gas and optical morphologies due to galaxy interaction or they have spectroscopically confirmed companions in close proximity (74%). This is likely due to the sample selection scheme and, in particular, the Hα EW and FUV luminosity requirements that select galaxies above the z = 0 SFMS, which are more likely to be involved in minor and major mergers.
We compared the 21 cm neutral gas properties of Lyα-emitters (EW ≥ 20 Å) to those of weak and non Lyα-emitters in the (e)LARS samples and to those of optically-selected z = 0 galaxies. We find that (e)LARS galaxies have similar HI gas masses and gas fraction for a given stellar mass as the bulk of optically selected galaxies at z = 0, regardless of their Lyα EW. Lyα-emitters with high EW tend to have a larger offset to the SFMS at a given HI mass than weak and non-emitters, but the samples overlap and cannot be distinguished statistically.
We compared the fraction of interacting galaxies to their Lyα emission class as defined by their equivalent width. A majority of (e)LARS galaxies are gravitationally interacting with a companion (74%) and this interacting fraction is slightly higher for objects with strong Lyα emission (83% for galaxies with EW ≥ 20 Å), as compared to those with weak or no Lyα emission (70% for objects with EW < 20 Å). A larger fraction of Lyα-emitters show HI morphologies (63% vs. 32%), optical morphologies (50% vs. 33%), and disturbed Hα kinematics (33% vs. 23%) characteristic of galaxy interaction than weak and non Lyα-emitters. Additionally, interacting Lyα-emitters present a large range of HI gas fractions, while non-interacting Lyα-emitters all have HI gas fraction significantly lower than the bulk of z = 0 galaxies. While interacting and non-interacting subsamples significantly overlap in Lyα and HI properties and cannot be differentiated statistically, our results indicate two possible modes of emission for Lyα depending on the HI mass of the host galaxy. One of the modes would require mergers to sufficiently disturb neutral gas in the ISM and CGM to enable Lyα emission, while in the other, emission could happen in normal star-forming galaxies, provided their HI mass is low. However, the viewing angle of a system (and additionally for mergers), the mass ratio or stage of interaction at which the galaxies are observed ultimately likely plays a determining role in the observed Lyα properties.
Finally, global properties derived with the 21 cm line exhibit no statistically robust correlation with Lyα observables (LLyα, EW or fesc), no matter whether they characterize HI content or kinematics. We note that the aperture used to extract Lyα information is significantly smaller than the minimum resolution element in 21 cm to which they are compared. Nevertheless, this indicates that if neutral gas plays a role in Lyα transfer, it likely does so on smaller scales than those probed here (< 30 kpc). Additional VLA data obtained with the C-array configuration will be used to establish the relation between Lyα and HI observables on scales of ∼10 kpc in a future publication. These data will allow investigations of the impact of neutral gas content and geometry on Lyα emission on matched scales that will help determine whether neutral HI gas significantly impacts the Lyα emission from galaxies.
Data availability
The figures showing the 21 cm line moment maps and spectra for all (e)LARS galaxies observed with the VLA in D-array are publicly available on Zenodo (https://doi.org/10.5281/zenodo.14036268).
The VLA is operated by the National Radio Astronomy Observatory.
Publicly available on https://github.com/Knusper/kendall.
Acknowledgments
ALR thanks Stephen Pardy, Brian Eisner, Kathleen Fitzgibbon and Bridget Reilly for sharing their VLA data reduction manuscripts for the LARS and eLARS projects, part of which were used to reduce the data presented here; Hayley Roberts and Kameswara Bharadwaj Mantha for helpful discussions on galaxy merger identification; and Kelley Hess for providing preliminary Apertif data of (e)LARS galaxies for verification of VLA measurements. The National Radio Astronomy Observatory is a facility of the National Science Foundation operated under cooperative agreement by Associated Universities, Inc. This research is based on observations made with the NASA/ESA Hubble Space Telescope obtained from the Space Telescope Science Institute, which is operated by the Association of Universities for Research in Astronomy, Inc., under NASA contract NAS 5–26555. These observations are associated with programs 12310, 13483, 13027, 14923, and 13656. The Legacy Surveys consist of three individual and complementary projects: the Dark Energy Camera Legacy Survey (DECaLS; Proposal ID #2014B-0404; PIs: David Schlegel and Arjun Dey), the Beijing-Arizona Sky Survey (BASS; NOAO Prop. ID #2015A-0801; PIs: Zhou Xu and Xiaohui Fan), and the Mayall z-band Legacy Survey (MzLS; Prop. ID #2016A-0453; PI: Arjun Dey). DECaLS, BASS and MzLS together include data obtained, respectively, at the Blanco telescope, Cerro Tololo Inter-American Observatory, NSF’s NOIRLab; the Bok telescope, Steward Observatory, University of Arizona; and the Mayall telescope, Kitt Peak National Observatory, NOIRLab. Pipeline processing and analyses of the data were supported by NOIRLab and the Lawrence Berkeley National Laboratory (LBNL). The Legacy Surveys project is honored to be permitted to conduct astronomical research on Iolkam Du’ag (Kitt Peak), a mountain with particular significance to the Tohono O’odham Nation. The full acknowledgment for the legacy surveys can be found at https://www.legacysurvey.org/acknowledgment/. This work makes use of data from the Apertif system installed at the Westerbork Synthesis Radio Telescope owned by ASTRON. ASTRON, the Netherlands Institute for Radio Astronomy, is an institute of the Dutch Science Organisation (De Nederlandse Organisatie voor Wetenschappelijk Onderzoek, NWO). A.L.R. was supported by Stockholm University. M.J.H. is supported by the Swedish Research Council (Vetenskapsrådet) and is Fellow of the Knut & Alice Wallenberg Foundation. J.M. is funded by the Swedish National Space Agency (SNSA, grant 2021-00083). G.O. acknowledges support from Vetenskapsrådet (VR) and the Swedish National Space Agency (SNSA). D.K. is supported by the Centre National d’Etudes Spatiales (CNES)/Centre National de la Recherche Scientifique (CNRS); convention no 230400.
References
- Adams, E. A. K., Adebahr, B., de Blok, W. J. G., et al. 2022, A&A, 667, A38 [NASA ADS] [CrossRef] [EDP Sciences] [Google Scholar]
- Atek, H., Kunth, D., Schaerer, D., et al. 2009, A&A, 506, L1 [NASA ADS] [CrossRef] [EDP Sciences] [Google Scholar]
- Blecher, T., Deane, R., Heywood, I., & Obreschkow, D. 2019, MNRAS, 484, 3681 [NASA ADS] [CrossRef] [Google Scholar]
- Brinchmann, J., Charlot, S., White, S. D. M., et al. 2004, MNRAS, 351, 1151 [Google Scholar]
- Cannon, J. M., Skillman, E. D., Kunth, D., et al. 2004, ApJ, 608, 768 [NASA ADS] [CrossRef] [Google Scholar]
- CASA Team (Bean, B., et al.) 2022, PASP, 134, 114501 [NASA ADS] [CrossRef] [Google Scholar]
- Chowdhury, A., Kanekar, N., Chengalur, J. N., Sethi, S., & Dwarakanath, K. S. 2020, Nature, 586, 369 [Google Scholar]
- Cooke, J., Berrier, J. C., Barton, E. J., Bullock, J. S., & Wolfe, A. M. 2010, MNRAS, 403, 1020 [NASA ADS] [CrossRef] [Google Scholar]
- Curran, P. A. 2014, ArXiv e-prints [arXiv:1411.3816] [Google Scholar]
- Deane, R. P., Blecher, T., Obreschkow, D., & Heywood, I. 2024, MNRAS, 535, L70 [Google Scholar]
- Dey, A., Schlegel, D. J., Lang, D., et al. 2019, AJ, 157, 168 [Google Scholar]
- Dijkstra, M. 2014, PASA, 31, e040 [Google Scholar]
- Durbala, A., Finn, R. A., Crone Odekon, M., et al. 2020, AJ, 160, 271 [NASA ADS] [CrossRef] [Google Scholar]
- Dutta, S., Bera, A., Bait, O., et al. 2024, MNRAS, 531, 5140 [NASA ADS] [CrossRef] [Google Scholar]
- Fernández, X., Gim, H. B., van Gorkom, J. H., et al. 2016, ApJ, 824, L1 [Google Scholar]
- Gazagnes, S., Chisholm, J., Schaerer, D., et al. 2018, A&A, 616, A29 [NASA ADS] [CrossRef] [EDP Sciences] [Google Scholar]
- Gazagnes, S., Chisholm, J., Schaerer, D., Verhamme, A., & Izotov, Y. 2020, A&A, 639, A85 [NASA ADS] [CrossRef] [EDP Sciences] [Google Scholar]
- Georgakakis, A., Forbes, D. A., & Norris, R. P. 2000, MNRAS, 318, 124 [NASA ADS] [CrossRef] [Google Scholar]
- Giavalisco, M., Koratkar, A., & Calzetti, D. 1996, ApJ, 466, 831 [NASA ADS] [CrossRef] [Google Scholar]
- Guaita, L., Melinder, J., Hayes, M., et al. 2015, A&A, 576, A51 [NASA ADS] [CrossRef] [EDP Sciences] [Google Scholar]
- Hagen, A., Zeimann, G. R., Behrens, C., et al. 2016, ApJ, 817, 79 [CrossRef] [Google Scholar]
- Haiman, Z., & Spaans, M. 1999, ApJ, 518, 138 [NASA ADS] [CrossRef] [Google Scholar]
- Hayes, M., Östlin, G., Mas-Hesse, J. M., et al. 2005, A&A, 438, 71 [NASA ADS] [CrossRef] [EDP Sciences] [Google Scholar]
- Hayes, M., Östlin, G., Duval, F., et al. 2014, ApJ, 782, 6 [NASA ADS] [CrossRef] [Google Scholar]
- Hayes, M. J., Runnholm, A., Scarlata, C., Gronke, M., & Rivera-Thorsen, T. E. 2023, MNRAS, 520, 5903 [NASA ADS] [CrossRef] [Google Scholar]
- Haynes, M. P., Giovanelli, R., Kent, B. R., et al. 2018, ApJ, 861, 49 [Google Scholar]
- Henry, A., Scarlata, C., Martin, C. L., & Erb, D. 2015, ApJ, 809, 19 [Google Scholar]
- Herenz, E. C., Schaible, A., Laursen, P., et al. 2024, A&A, in press https://doi.org/10.1051/0004-6361/202451012 [Google Scholar]
- Hess, K. M., Serra, P., Boschman, L., Shen, A., & Healy, J. 2022, https://doi.org/10.5281/zenodo.6821586 [Google Scholar]
- Holwerda, B. W., Pirzkal, N., de Blok, W. J. G., et al. 2011, MNRAS, 416, 2437 [CrossRef] [Google Scholar]
- Huberty, M., Carr, C., Scarlata, C., et al. 2024, ApJ, 975, 58 [NASA ADS] [CrossRef] [Google Scholar]
- Isobe, T., Feigelson, E. D., & Nelson, P. I. 1986, ApJ, 306, 490 [Google Scholar]
- Jaskot, A. E., Dowd, T., Oey, M. S., Scarlata, C., & McKinney, J. 2019, ApJ, 885, 96 [Google Scholar]
- Kanekar, N., Ghosh, T., Rhoads, J., et al. 2021, ApJ, 913, L15 [NASA ADS] [CrossRef] [Google Scholar]
- Kepley, A. A., Tsutsumi, T., Brogan, C. L., et al. 2020, PASP, 132, 024505D [CrossRef] [Google Scholar]
- Konno, A., Ouchi, M., Shibuya, T., et al. 2018, PASJ, 70, S16 [Google Scholar]
- Kunth, D., Mas-Hesse, J. M., Terlevich, E., et al. 1998, A&A, 334, 11 [NASA ADS] [Google Scholar]
- Le Reste, A., Hayes, M., Cannon, J. M., et al. 2022, ApJ, 934, 69 [NASA ADS] [CrossRef] [Google Scholar]
- Le Reste, A., Cannon, J. M., Hayes, M. J., et al. 2024, MNRAS, 528, 757 [NASA ADS] [CrossRef] [Google Scholar]
- Martin, C. L., Dijkstra, M., Henry, A., et al. 2015, ApJ, 803, 6 [Google Scholar]
- Mas-Hesse, J. M., Kunth, D., Tenorio-Tagle, G., et al. 2003, ApJ, 598, 858 [NASA ADS] [CrossRef] [Google Scholar]
- Melinder, J., Östlin, G., Hayes, M., et al. 2023, ApJS, 266, 15 [NASA ADS] [CrossRef] [Google Scholar]
- Mentuch Cooper, E., Gebhardt, K., Davis, D., et al. 2023, ApJ, 943, 177 [NASA ADS] [CrossRef] [Google Scholar]
- Micheva, G., Östlin, G., Zackrisson, E., et al. 2018, A&A, 615, A46 [NASA ADS] [CrossRef] [EDP Sciences] [Google Scholar]
- Östlin, G., Hayes, M., Duval, F., et al. 2014, ApJ, 797, 11 [CrossRef] [Google Scholar]
- Östlin, G., Rivera-Thorsen, T. E., Menacho, V., et al. 2021, ApJ, 912, 155 [CrossRef] [Google Scholar]
- Ouchi, M., Ono, Y., & Shibuya, T. 2020, ARA&A, 58, 617 [Google Scholar]
- Pardy, S. A., Cannon, J. M., Östlin, G., et al. 2014, ApJ, 794, 101 [NASA ADS] [CrossRef] [Google Scholar]
- Parker, K. S., Berg, D. A., Gazagnes, S., et al. 2024, ApJ, 977, 104 [NASA ADS] [CrossRef] [Google Scholar]
- Purkayastha, S., Kanekar, N., Chengalur, J. N., et al. 2022, ApJ, 933, L11 [NASA ADS] [CrossRef] [Google Scholar]
- Quider, A. M., Pettini, M., Shapley, A. E., & Steidel, C. C. 2009, MNRAS, 398, 1263 [Google Scholar]
- Reddy, N. A., Steidel, C. C., Pettini, M., Bogosavljević, M., & Shapley, A. E. 2016, ApJ, 828, 108 [Google Scholar]
- Reddy, N. A., Topping, M. W., Shapley, A. E., et al. 2022, ApJ, 926, 31 [NASA ADS] [CrossRef] [Google Scholar]
- Rivera-Thorsen, T. E., Hayes, M., Östlin, G., et al. 2015, ApJ, 805, 14 [Google Scholar]
- Roberts, M. S., & Haynes, M. P. 1994, ARA&A, 32, 115 [NASA ADS] [CrossRef] [Google Scholar]
- Runnholm, A., Gronke, M., & Hayes, M. 2021, PASP, 133, 034507D [CrossRef] [Google Scholar]
- Salim, S., Rich, R. M., Charlot, S., et al. 2007, ApJS, 173, 267 [NASA ADS] [CrossRef] [Google Scholar]
- Salim, S., Lee, J. C., Janowiecki, S., et al. 2016, ApJS, 227, 2 [NASA ADS] [CrossRef] [Google Scholar]
- Savage, B. D., & Sembach, K. R. 1996, ARA&A, 34, 279 [Google Scholar]
- Serra, P., Westmeier, T., Giese, N., et al. 2015, MNRAS, 448, 1922 [Google Scholar]
- Shapley, A. E., Steidel, C. C., Pettini, M., & Adelberger, K. L. 2003, ApJ, 588, 65 [Google Scholar]
- Solomon, P. M., & Sage, L. J. 1988, ApJ, 334, 613 [NASA ADS] [CrossRef] [Google Scholar]
- Speagle, J. S., Steinhardt, C. L., Capak, P. L., & Silverman, J. D. 2014, ApJS, 214, 15 [Google Scholar]
- Stark, D. P., Ellis, R. S., Chiu, K., Ouchi, M., & Bunker, A. 2010, MNRAS, 408, 1628 [Google Scholar]
- Steidel, C. C., Bogosavljević, M., Shapley, A. E., et al. 2018, ApJ, 869, 123 [Google Scholar]
- Ventou, E., Contini, T., Bouché, N., et al. 2019, A&A, 631, A87 [NASA ADS] [CrossRef] [EDP Sciences] [Google Scholar]
- Verhamme, A., Schaerer, D., & Maselli, A. 2006, A&A, 460, 397 [NASA ADS] [CrossRef] [EDP Sciences] [Google Scholar]
- Westmeier, T., Kitaeff, S., Pallot, D., et al. 2021, MNRAS, 506, 3962 [NASA ADS] [CrossRef] [Google Scholar]
- Witten, C., Laporte, N., Martin-Alvarez, S., et al. 2024, Nat. Astron., 8, 384 [Google Scholar]
- Wofford, A., Leitherer, C., & Salzer, J. 2013, ApJ, 765, 118 [NASA ADS] [CrossRef] [Google Scholar]
Appendix A: Additional tables
Here, we present tables containing properties of the LARS and eLARS samples studied in this manuscript. Specifically, parameters characterizing the VLA D-array observations of the (e)LARS samples are shown in Table A.1. In Table A.2, we present general galaxy properties and Lyα observables for the LARS and eLARS sample. Finally in Table A.3, we list the 21cm lines properties for the LARS and eLARS galaxies observed with the VLA in D-array configuration. We include both the properties measured within a synthesized beam apertures, and in the SoFIA-2 detection mask where S/N> 3.
VLA observation and clean image properties of the LARS and eLARS galaxies.
General properties of the LARS and eLARS galaxies.
Neutral gas properties derived from 21cm VLA D configuration observations of the LARS and eLARS samples.
Appendix B: Comparison with Apertif and GBT data
Here, we compare the HI mass values measured in the manuscript to those obtained with the GBT and VLA, presented in Pardy et al. (2014), and to preliminary data from the Apertif survey (Adams et al. 2022, data for (e)LARS obtained through private communication with K. Hess, ∼20" beam) to evaluate the quality of our measurements and data reduction. At the time when we conducted this test, three (e)LARS galaxies had available Apertif imaging: LARS04, eLARS08, and eLARS17. If we assume 10% flux calibrator uncertainties, the Apertif and VLA measurements made in this manuscript agree within 1σ for LARS04 and eLARS08, and the difference between measurements for eLARS17 is within 2.4σ. In comparison, the GBT mass for LARS04 is lower than the Apertif and present VLA measurements by 2.5σ, while the VLA mass reported in Pardy et al. (2014) is lower by more than 3σ. The GBT has a beam of 8′ and should recover flux from the diffuse gas that is missed by the interferometric measurements; thus, the difference in measurements is unexpected. Inspecting the GBT profiles shown in Pardy et al. (2014), it is apparent that the spectra are strongly impacted by noise. We thus attribute the significant offset to a misplacement of the baseline in the GBT spectra, leading to an underestimation of the 21cm flux as measured with the GBT. The VLA measurements made in Pardy et al. (2014) are also lower, with a value different by over 3σ for LARS04 than our own estimates and the Apertif value. Since the Apertif data was independently reduced by an experienced team using a different telescope, and since they agree with our estimates, we believe the measurements presented here should supersede the values in Pardy et al. (2014).
Appendix C: GSWLC and SDSS stellar masses and SFRs
Here, we compare the stellar masses and SFRs obtained through SED fitting in GSWLC to the values retrieved from the SDSS DR8 MPA-JHU catalog. The masses and star formation rates for the two catalogs are presented in Fig. C.1, they are in relatively good agreement. We performed a linear least square fit to the data (with single iteration 10σ outliers removal) to infer the GSWLC masses and SFRs from the SDSS values for the seven galaxies with missing GSWLC data. The fit to the stellar mass and SFR is shown on Fig. C.1, inferred values are presented in Table A.2.
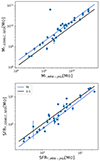 |
Fig. C.1. Galaxy properties for (e)LARS galaxies in the GSWLC and SDSS DR8 MPA-JHU catalog. The top panel shows the stellar masses, while the bottom panel presents the star formation rates in the two different catalogs. The black line shows the 1:1 relation and the blue line shows the fit to the data. |
All Tables
Galaxies identified as gravitationally interacting with a companion in the (e)LARS samples.
Results of the K-S tests run to assess whether different samples considered in this manuscript are statistically different in terms of their observables.
Neutral gas properties derived from 21cm VLA D configuration observations of the LARS and eLARS samples.
All Figures
|
Fig. 1. 21 cm maps and spectra of eLARS04. The field of view has been adapted to show the full extent of the main SoFIA 2 detection. Top left: DECaLS optical composite image with HI column density contours at level 1.0 × 2n × 1019 cm−2, with n = 0, 1, 2, …, 5 overlaid. The blue solid line shows the regions with S/N > 3. Contours fully included in the S/N ≥ 3 mask are shown in white, low signal-to-noise contours are shown in gray. A gray cross indicates the position of the galaxy according to optical coordinates, a synthesized beam shaped aperture centred on these coordinates was used to extract HI properties in the center. Top right: Column density map with the same contours as on the previous panel overlaid. Middle left: Moment-1 map. Middle right: Linewidth map. Bottom: Total 21 cm spectrum (gray) and beam-extracted 21 cm spectrum (black). Velocity centroids are indicated by a vertical solid line, and velocity at half width on either side of the peaks by dashed lines, in either gray or black for the total or beam extraction respectively. |
| In the text | |
|
Fig. 2. DECaLS optical g, r, and z band color-composite images of galaxies in the LARS and eLARS samples with HI 21 cm column density contours overlaid. The contours have fixed levels of 2n × 1019 cm−2, with n = 0, 1, 2, …, 5. White contours have S/N ≥ 3, while the low signal-to-noise contours are shown in gray. All images are 300 × 300 kpc2, and are centered upon the coordinates of the galaxies. The contours show the main SoFIA 2 detection, apart from eLARS05 and eLARS10 for which an ancillary detection is shown in grey to the south east. A star on the lower right corner of a panel indicates the galaxy has been identified as undergoing interaction. |
| In the text | |
|
Fig. 3. HI properties and galaxy properties for the (e)LARS sample and optically-selected galaxies from SDSS-ALFALFA (Durbala et al. 2020). In all panels, we split the (e)LARS sample between objects considered Lyα emitters (EWLyα ≥ 20 Å, in black) and weak and non-emitters (EWLyα < 20 Å, in gray). The SDSS/ALFALFA galaxies are shown in blue. Squares indicate the median in stellar mass or HI mass bins, blue squares show the median for the SDSS/ALFALFA galaxies, black squares the median for the (e)LARS Lyα-emitters, and gray squares the median for the weak and non Lyα-emitters. The error bars associated with the median points show the standard deviation within a given mass bin. In the top-left panel, the solid black line shows the SFMS at z = 0 (Speagle et al. 2014). |
| In the text | |
|
Fig. 4. HI properties extracted in the synthesized beam-shaped aperture as a function of Lyα observables. From left to right, the x-axis shows the Lyα luminosity, Lyα equivalent width and Lyα escape fraction. From top to bottom, the y-axis shows the HI mass, the HI gas to stellar mass fraction, the HI mass per unit star formation rate, HI linewidth, and offset between Lyα red peak and HI centroid velocity. Generalized Kendall τ, p-values and sample sizes associated with each scatter plot are shown on the top left corner of each panel. |
| In the text | |
|
Fig. 5. HI mass as a function of the stellar mass for SDSS/ALFALFA galaxies (in blue) and (e)LARS galaxies for objects classified as interacting and non-interacting. We show the position of Lyα-emitters with EWLyα > 20 Å on the top panel and weak or non-emitters on the bottom panel. The square blue markers show the median in bins of stellar mass for SDSS/ALFALFA galaxies. Circles indicate galaxies not identified as undergoing gravitational interaction, while stars show the objects classified as interacting. Only galaxies observed in 21 cm are shown here. |
| In the text | |
|
Fig. C.1. Galaxy properties for (e)LARS galaxies in the GSWLC and SDSS DR8 MPA-JHU catalog. The top panel shows the stellar masses, while the bottom panel presents the star formation rates in the two different catalogs. The black line shows the 1:1 relation and the blue line shows the fit to the data. |
| In the text | |
Current usage metrics show cumulative count of Article Views (full-text article views including HTML views, PDF and ePub downloads, according to the available data) and Abstracts Views on Vision4Press platform.
Data correspond to usage on the plateform after 2015. The current usage metrics is available 48-96 hours after online publication and is updated daily on week days.
Initial download of the metrics may take a while.