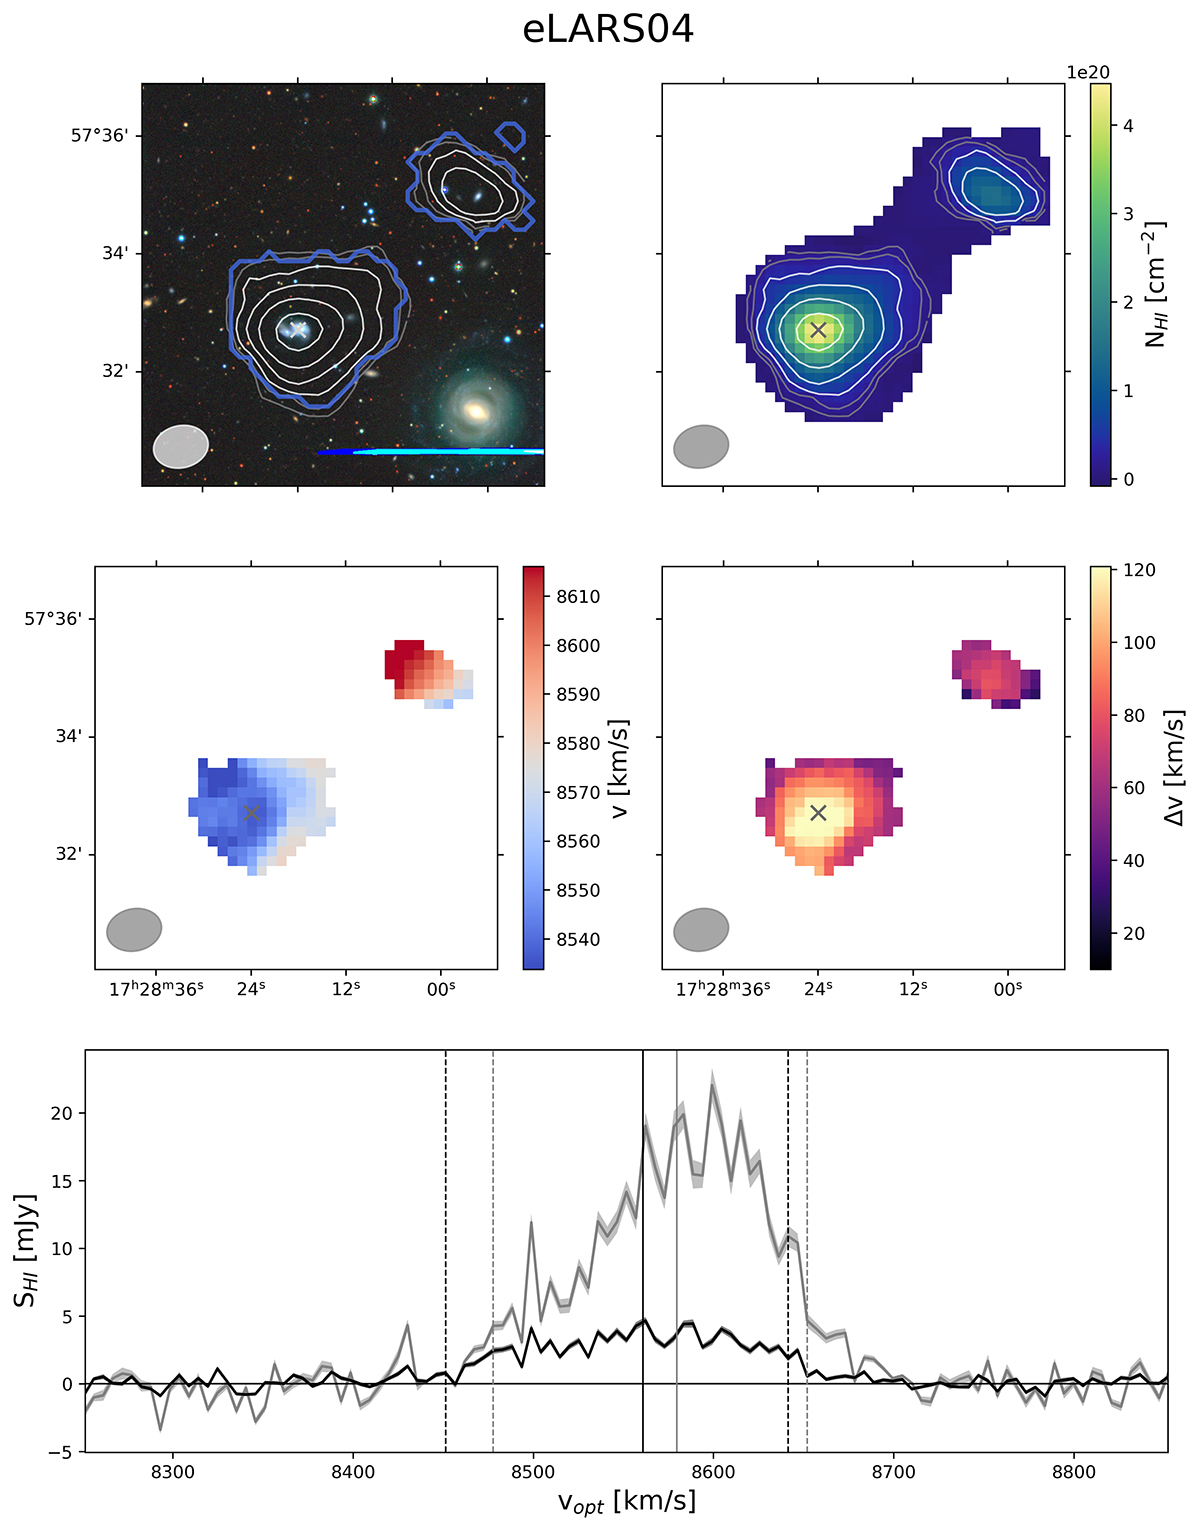
Fig. 1.
Download original image
21 cm maps and spectra of eLARS04. The field of view has been adapted to show the full extent of the main SoFIA 2 detection. Top left: DECaLS optical composite image with HI column density contours at level 1.0 × 2n × 1019 cm−2, with n = 0, 1, 2, …, 5 overlaid. The blue solid line shows the regions with S/N > 3. Contours fully included in the S/N ≥ 3 mask are shown in white, low signal-to-noise contours are shown in gray. A gray cross indicates the position of the galaxy according to optical coordinates, a synthesized beam shaped aperture centred on these coordinates was used to extract HI properties in the center. Top right: Column density map with the same contours as on the previous panel overlaid. Middle left: Moment-1 map. Middle right: Linewidth map. Bottom: Total 21 cm spectrum (gray) and beam-extracted 21 cm spectrum (black). Velocity centroids are indicated by a vertical solid line, and velocity at half width on either side of the peaks by dashed lines, in either gray or black for the total or beam extraction respectively.
Current usage metrics show cumulative count of Article Views (full-text article views including HTML views, PDF and ePub downloads, according to the available data) and Abstracts Views on Vision4Press platform.
Data correspond to usage on the plateform after 2015. The current usage metrics is available 48-96 hours after online publication and is updated daily on week days.
Initial download of the metrics may take a while.