Fig. 4.
Download original image
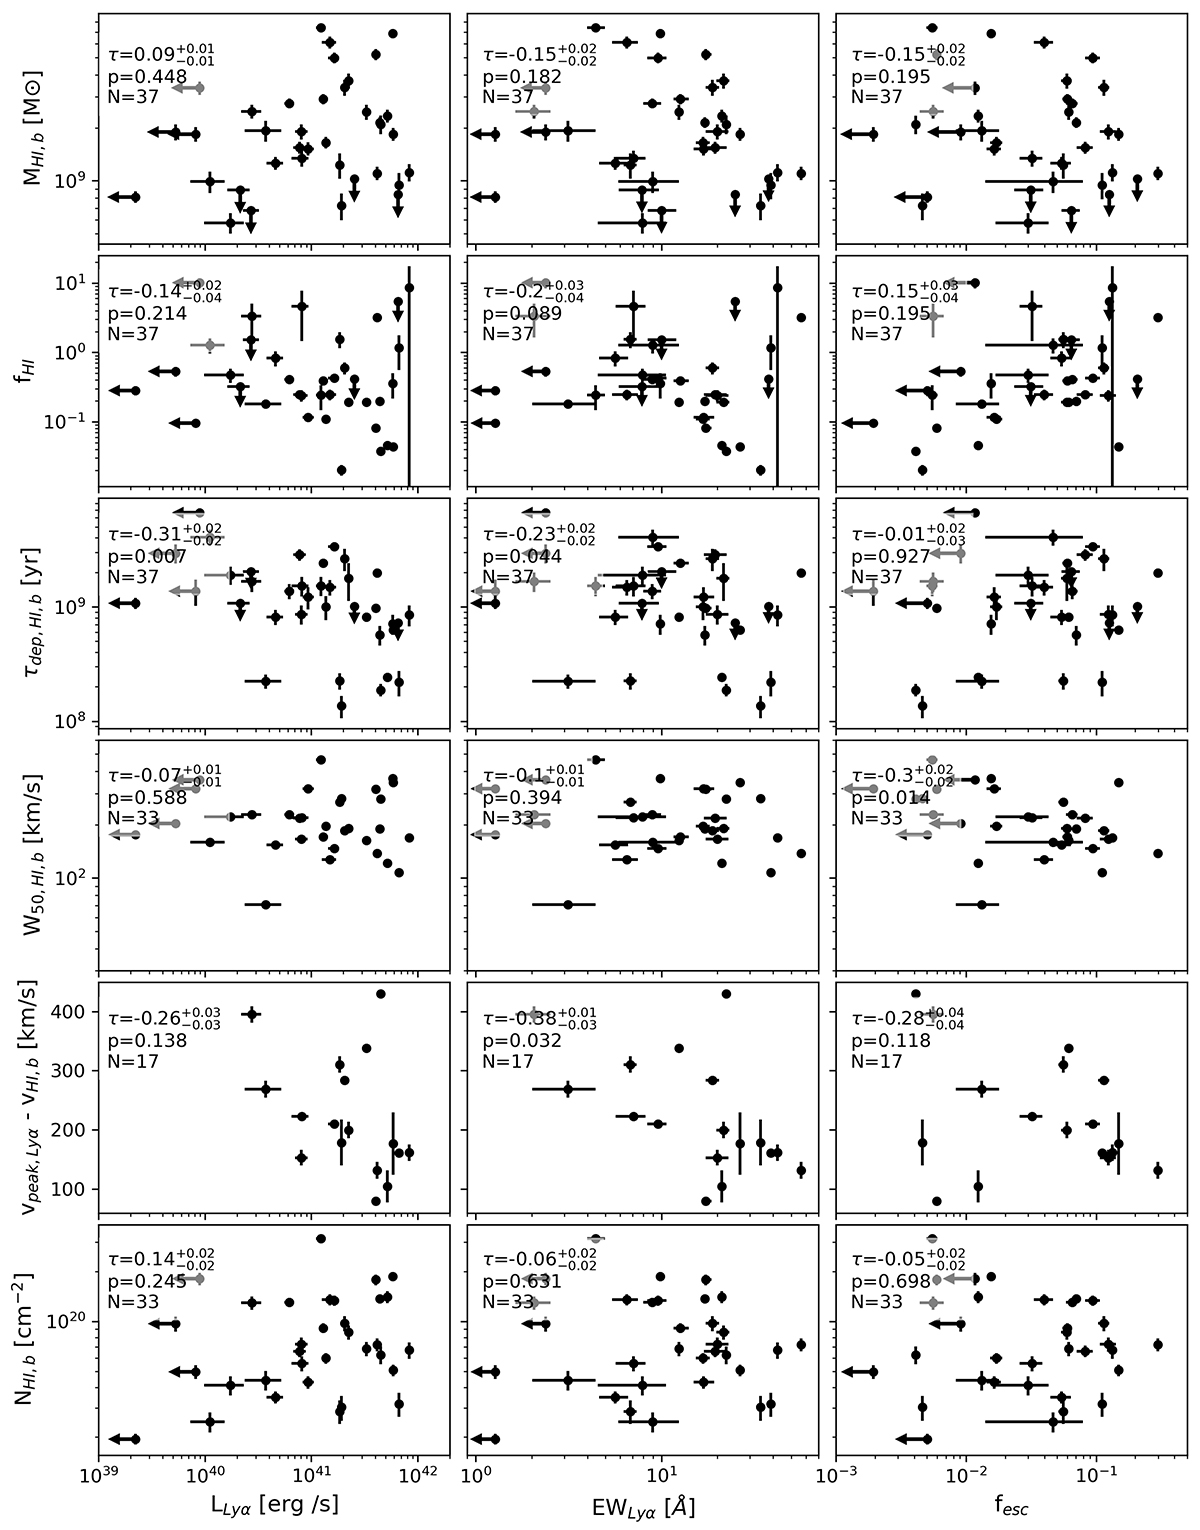
HI properties extracted in the synthesized beam-shaped aperture as a function of Lyα observables. From left to right, the x-axis shows the Lyα luminosity, Lyα equivalent width and Lyα escape fraction. From top to bottom, the y-axis shows the HI mass, the HI gas to stellar mass fraction, the HI mass per unit star formation rate, HI linewidth, and offset between Lyα red peak and HI centroid velocity. Generalized Kendall τ, p-values and sample sizes associated with each scatter plot are shown on the top left corner of each panel.
Current usage metrics show cumulative count of Article Views (full-text article views including HTML views, PDF and ePub downloads, according to the available data) and Abstracts Views on Vision4Press platform.
Data correspond to usage on the plateform after 2015. The current usage metrics is available 48-96 hours after online publication and is updated daily on week days.
Initial download of the metrics may take a while.