Fig. 8.
Download original image
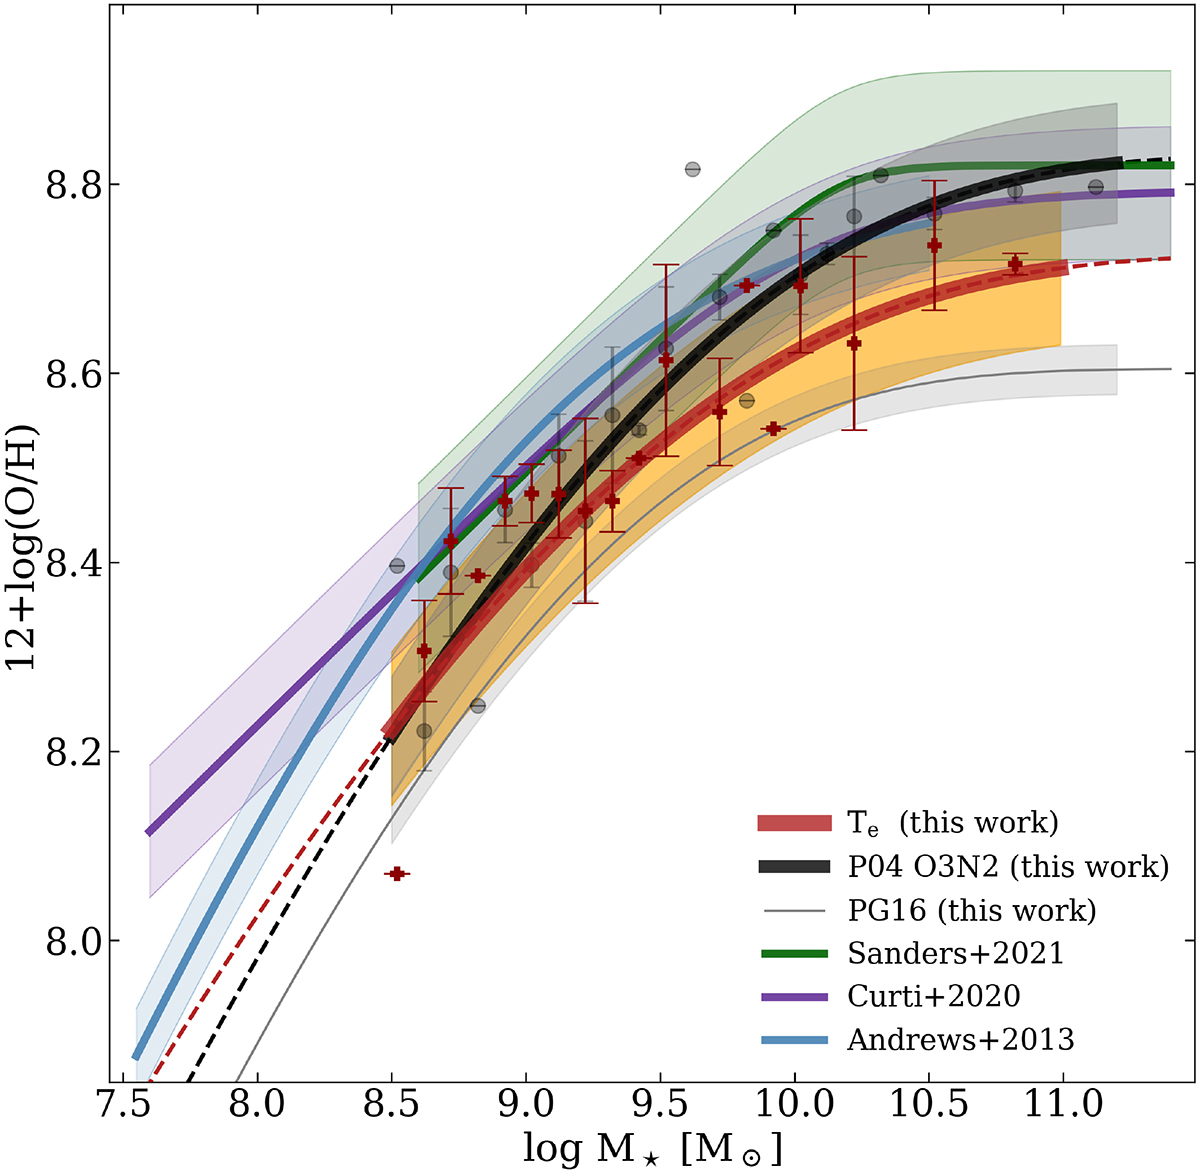
MZR obtained using Te-based metallicities from the stacked spectra (solid brown line) compared to the MZR obtained using strong-line methods (P04 O3N2 and PG16) and relations from the literature. Direct-method measurements (8.5 < logM⋆/M⊙ < 11.0) are shown in brown, with the line representing the best fit following the Eq. (8) functional form, and the shaded region indicating the standard deviation of metallicity distributed around the fit. Metallicity measurements via empirical calibrations (PG16 and P04) from our sample are represented in gray and black, respectively. The comparisons with the characterizations of the MZR from Andrews & Martini (2013), Curti et al. (2020a), and Sanders et al. (2021) are depicted by the blue, purple, and green lines, respectively, along with their corresponding standard deviations. Metallicity values, global and radially binned, are available online (see Tables B.5 and B.6).
Current usage metrics show cumulative count of Article Views (full-text article views including HTML views, PDF and ePub downloads, according to the available data) and Abstracts Views on Vision4Press platform.
Data correspond to usage on the plateform after 2015. The current usage metrics is available 48-96 hours after online publication and is updated daily on week days.
Initial download of the metrics may take a while.