Fig. 6.
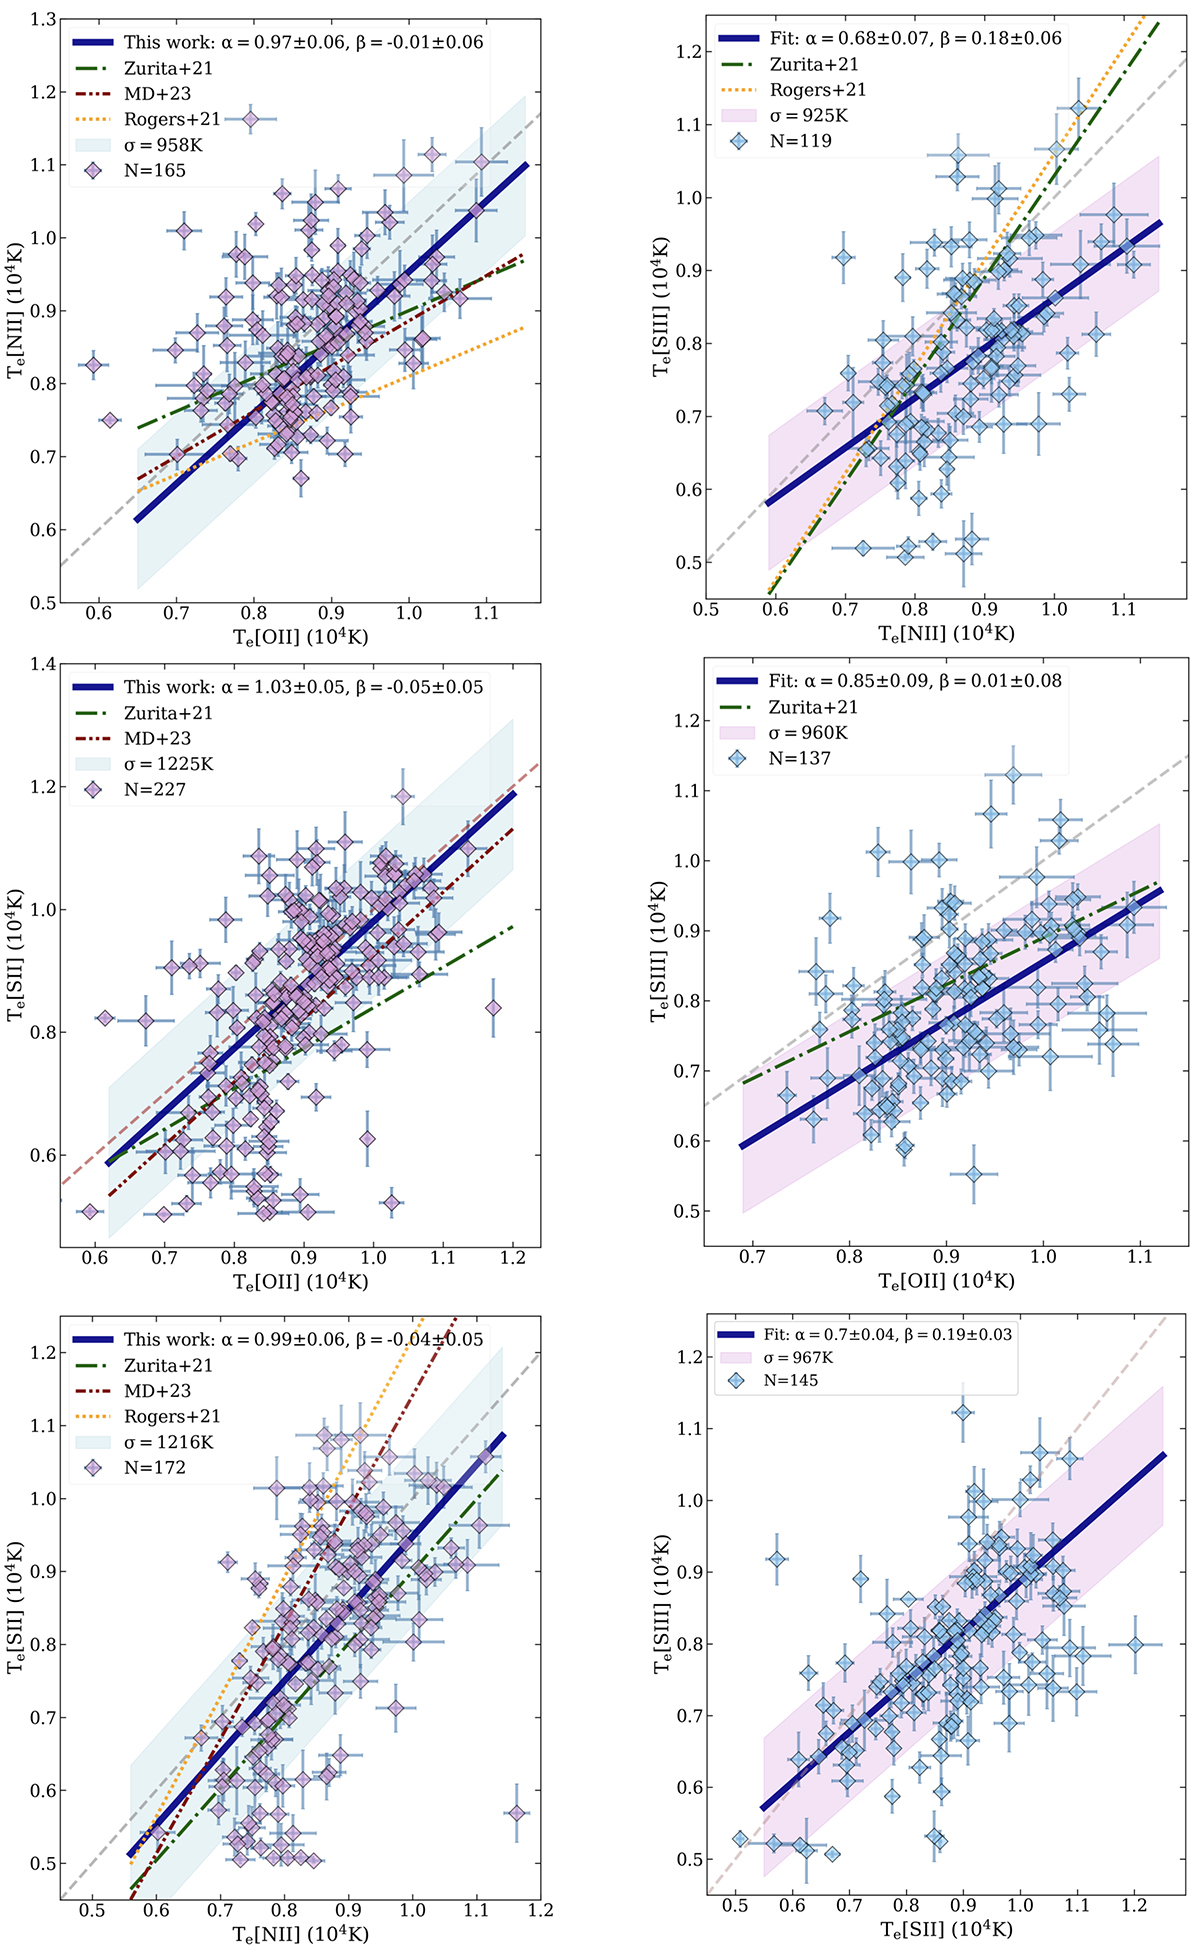
Download original image
Te data for [O II], [N II], [S II], and [S III] auroral lines for our galaxy sample in 56 SFR–M⋆ bins across six different radii. The columns are ordered by ionization zone relations: different low-ionized zones, Te, are compared in the left panels and low- and high-ionized zones, Te, are compared in the right. The solid lines indicate the linear fit to error-weighted sigma-clipped temperatures, and the dashed lines represent the one-to-one relation. The shaded regions (σ) represent the standard deviation of temperatures distributed around the fitted values. The number of data points (N°) is specified for each panel, and error bars represent the official temperature errors outlined in Sect. 3.4. The dashed-dotted green and red lines represent the T–T relations introduced by Zurita et al. (2021) and Méndez-Delgado et al. (2023; MD+23), respectively, while the dotted orange line shows the relation reported by Rogers et al. (2021).
Current usage metrics show cumulative count of Article Views (full-text article views including HTML views, PDF and ePub downloads, according to the available data) and Abstracts Views on Vision4Press platform.
Data correspond to usage on the plateform after 2015. The current usage metrics is available 48-96 hours after online publication and is updated daily on week days.
Initial download of the metrics may take a while.