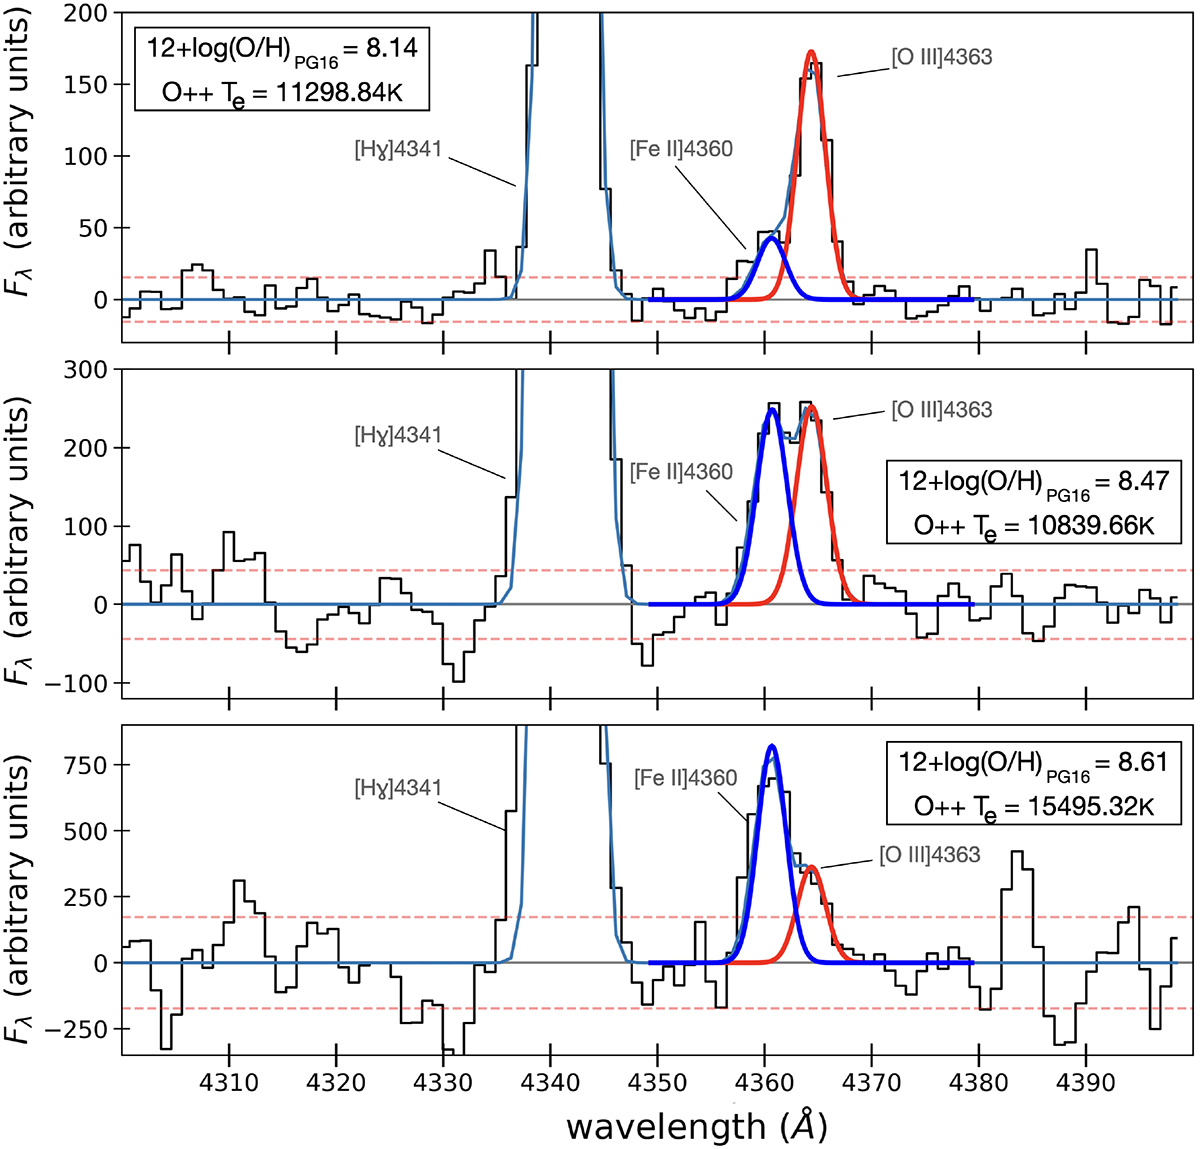
Fig. 4.
Download original image
Spectral residuals in the wavelength range near the [O III]λ4363 line, after stellar continuum subtraction. The red and blue Gaussian fits represent [O III]λ4363 and [Fe II]λ4360 emission lines, respectively. The dashed lines illustrate the standard deviation of residual fits in the corresponding windows. The strong-line metallicity and measured [O III] temperature of each stack are reported in the panels. The contamination of the [O III]λ4363 line becomes more relevant with increasing metallicity.
Current usage metrics show cumulative count of Article Views (full-text article views including HTML views, PDF and ePub downloads, according to the available data) and Abstracts Views on Vision4Press platform.
Data correspond to usage on the plateform after 2015. The current usage metrics is available 48-96 hours after online publication and is updated daily on week days.
Initial download of the metrics may take a while.