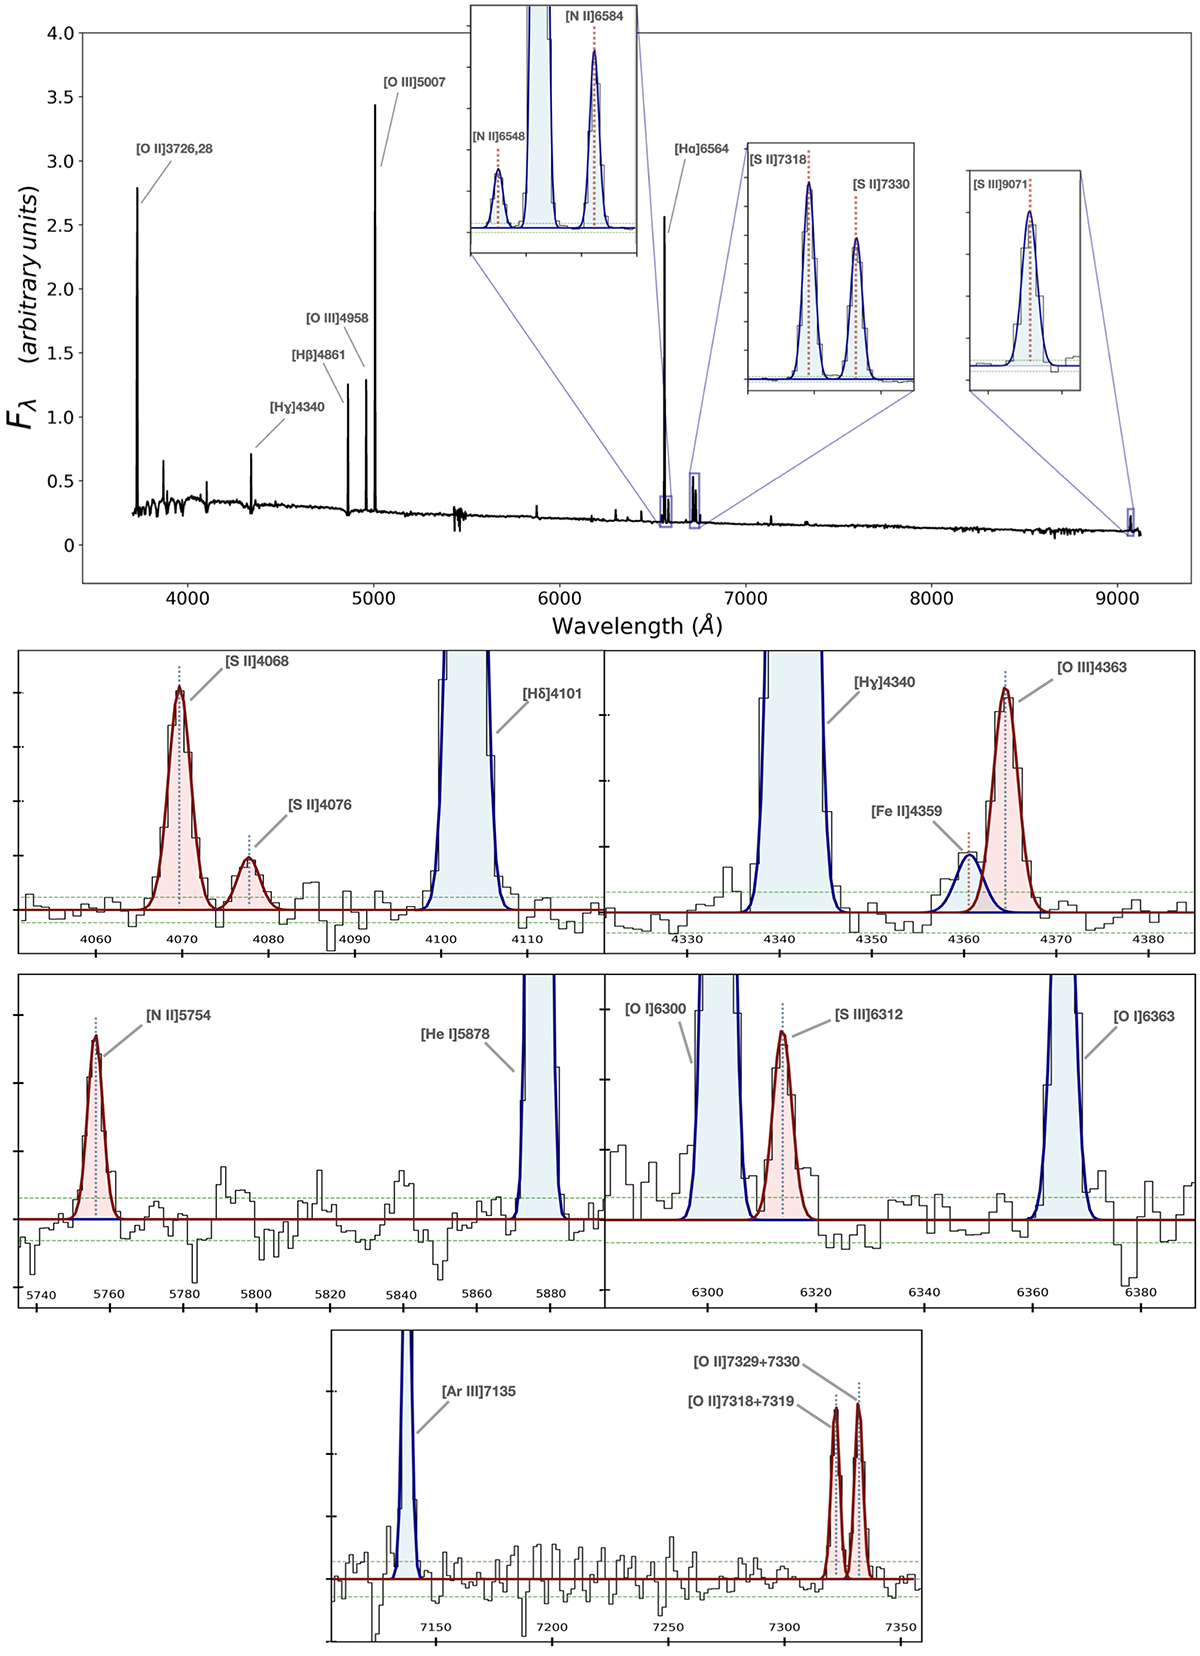
Fig. 3.
Download original image
Topmost panel: Stacked spectrum of a SFR–M⋆ bin (M⋆ = 108.65 M⊙ and SFR = 1−1.3 M⊙ yr−1), showing zoomed-in views of the spectral fits around some of the strong nebular lines. In the subplots below we zoom in on the fit residuals in specific spectral regions to highlight the detection of faint, temperature-sensitive auroral lines (in red) and other nearby emission lines (blue). The dashed green lines represent the standard deviation of residual fits in each wavelength window. The emission line fluxes and associated uncertainties, global and radially binned, are available online (see Tables B.3 and B.4).
Current usage metrics show cumulative count of Article Views (full-text article views including HTML views, PDF and ePub downloads, according to the available data) and Abstracts Views on Vision4Press platform.
Data correspond to usage on the plateform after 2015. The current usage metrics is available 48-96 hours after online publication and is updated daily on week days.
Initial download of the metrics may take a while.