Fig. 2.
Download original image
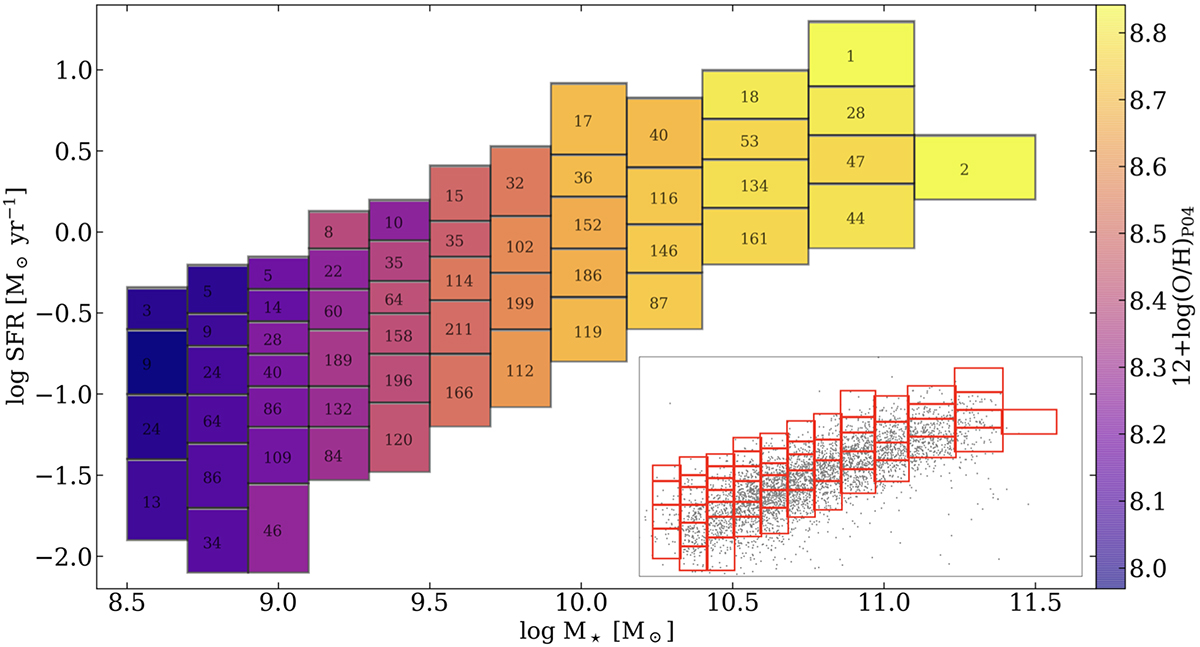
Position of the bins used for spectral stacking in this work in the SFR–M⋆ plane. Each rectangle represents a bin, color-coded according to its median strong-line metallicity using the Pettini & Pagel (2004) calibration and extinction-corrected emission lines from the MaNGA DAP catalog. The number of galaxies in each bin is reported. In the inset in the lower right, our stacking grid is shown superimposed on the distribution of individual MaNGA star-forming galaxies in the SFR–M⋆ plane. The integrated spectra, global and radially binned, are available online (see Tables B.2 and B.1).
Current usage metrics show cumulative count of Article Views (full-text article views including HTML views, PDF and ePub downloads, according to the available data) and Abstracts Views on Vision4Press platform.
Data correspond to usage on the plateform after 2015. The current usage metrics is available 48-96 hours after online publication and is updated daily on week days.
Initial download of the metrics may take a while.