Fig. 10.
Download original image
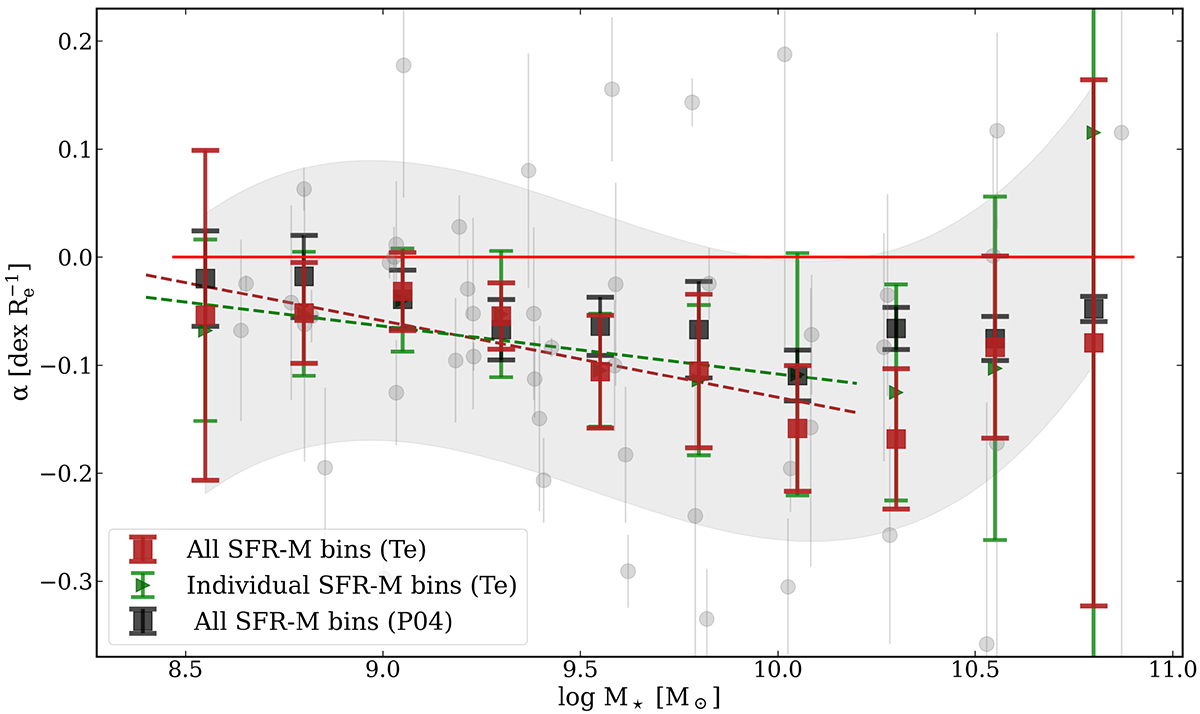
Metallicity gradient across a radial span of 0.0–1.5 Re using the Te (red) and P04 calibration based on O3N2 (black) as a function of stellar mass. The red data points correspond to the slopes depicted in Fig. 9, with error bars indicating the uncertainty in the slope. Each SFR − M⋆ bin’s slopes are shown with gray points, while green points represent the median value of slopes within a specific mass range. The gray shaded area represents a third-degree polynomial fit to the slopes of all SFR-M bins.
Current usage metrics show cumulative count of Article Views (full-text article views including HTML views, PDF and ePub downloads, according to the available data) and Abstracts Views on Vision4Press platform.
Data correspond to usage on the plateform after 2015. The current usage metrics is available 48-96 hours after online publication and is updated daily on week days.
Initial download of the metrics may take a while.