Fig. 3
Download original image
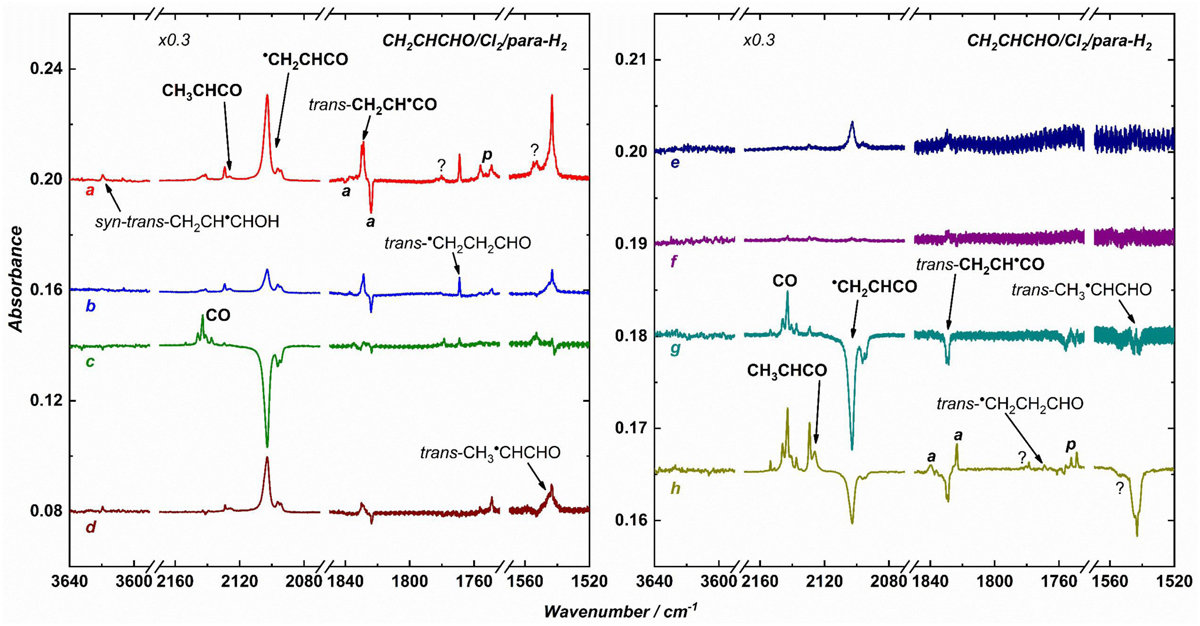
Difference FTIR spectra of the CH2CHCHO/Cl2/para-H2 sample illustrating the effect of the sequential 365 nm (60 min) + 2217 nm (100 min) irradiation (a), free sample standing after photolysis for 480 min (b), 365 nm (70 min) photolysis (c), 2217 nm (100 min) photolysis (d), 400 nm (20 min) photolysis (e), 330 nm (20 min) photolysis (f), 260 nm (20 min) photolysis (g), and 225 nm (20 min) photolysis (h). We note that the center-left panel is multiplied by 0.3 for a better representation. The absorption features attributed to the trans-CH2CHCHO and cis-CH3CH2CHO are marked with “a” and “p”, respectively. The unassigned absorption features are labeled with question signs.
Current usage metrics show cumulative count of Article Views (full-text article views including HTML views, PDF and ePub downloads, according to the available data) and Abstracts Views on Vision4Press platform.
Data correspond to usage on the plateform after 2015. The current usage metrics is available 48-96 hours after online publication and is updated daily on week days.
Initial download of the metrics may take a while.