Fig. 2.
Download original image
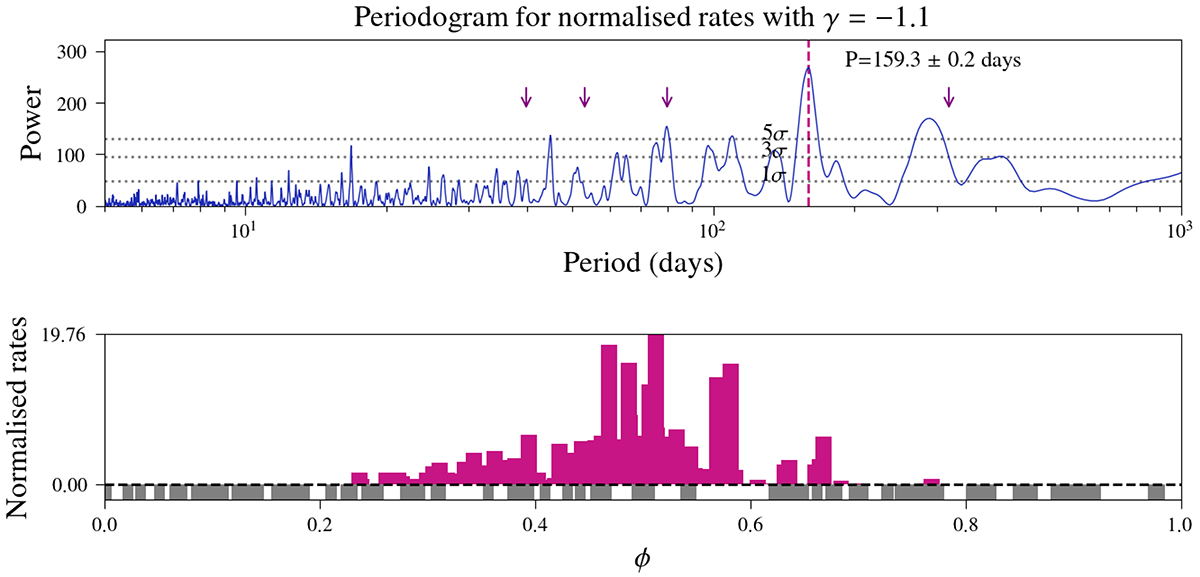
Periodogram for normalized rates. Top: L-band dataset periodogram for the normalised rates model. The arrows indicate some of the harmonics of the 159-day period. The peaks to the right of the plot are at roughly 290 and 380 days. They arise due to the superposition of the spacing of the two most active epochs of FRB 20121102A plus the second harmonic of the 159 days. The dotted horizontal lines correspond to the 1σ, 3σ, and 5σ significance levels determined by 10 000 bootstrap resamplings. Bottom: Observation-folding at 159 days. Observations with detections are highlighted in magenta and non-detections in grey. A little height was added to the non-detections for visualisation of phase domain coverage. The activity phase described by the magenta bars shows a Gaussian-like profile, where the detections peak in the centre.
Current usage metrics show cumulative count of Article Views (full-text article views including HTML views, PDF and ePub downloads, according to the available data) and Abstracts Views on Vision4Press platform.
Data correspond to usage on the plateform after 2015. The current usage metrics is available 48-96 hours after online publication and is updated daily on week days.
Initial download of the metrics may take a while.