| Issue |
A&A
Volume 695, March 2025
|
|
|---|---|---|
| Article Number | A100 | |
| Number of page(s) | 8 | |
| Section | Extragalactic astronomy | |
| DOI | https://doi.org/10.1051/0004-6361/202452834 | |
| Published online | 11 March 2025 | |
Repeating fast radio bursts from synchrotron maser radiation in localized plasma blobs: Application to FRB 20121102A
1
Guangxi Key Laboratory for Relativistic Astrophysics, School of Physical Science and Technology, Guangxi University, Nanning 530004, China
2
Institute of Astronomy and Astrophysics, School of Mathematics and Physics, Anqing Normal University, Anqing 246133, People’s Republic of China
⋆ Corresponding authors; This email address is being protected from spambots. You need JavaScript enabled to view it.
; This email address is being protected from spambots. You need JavaScript enabled to view it.
Received:
31
October
2024
Accepted:
8
February
2025
Abstract
The radiation physics of repeating fast radio bursts (FRBs) remains enigmatic. Motivated by the observed narrow-banded emission spectrum and ambiguous fringe pattern of the spectral peak frequency (νpk) distribution of some repeating FRBs, such as FRB 20121102A, we propose that the bursts from repeating FRBs arise from synchrotron maser radiation in localized blobs within weakly magnetized plasma that relativistically moves toward observers. Assuming the plasma moves toward the observers with a bulk Lorentz factor of Γ = 100 and the electron distribution in an individual blob is monoenergetic (γe ∼ 300), our analysis shows that bright and narrow-banded radio bursts with peak flux density ∼1 Jy at peak frequency (νpk) ∼3.85 GHz can be produced by the synchrotron maser emission if the plasma blob has a magnetization factor of σ ∼ 10−5 and a frequency of νP ∼ 4.5 MHz. The spectrum of bursts with lower νpk tends to be narrower. Applying our model to the bursts of FRB 20121102A, the distributions of both the observed νpk and isotropic energy Eiso detected by the Arecibo telescope at the L band and the Green Bank Telescope at the C band are successfully reproduced. We find that the νP distribution exhibits several peaks, similar to those observed in the νpk distribution of FRB 20121102A. This implies that the synchrotron maser emission in FRB 20121102A is triggered in different plasma blobs with varying νP, likely due to the inhomogeneity of relativistic electron number density.
Key words: masers / plasmas / radiation mechanisms: non-thermal
© The Authors 2025
 Open Access article, published by EDP Sciences, under the terms of the Creative Commons Attribution License (https://creativecommons.org/licenses/by/4.0), which permits unrestricted use, distribution, and reproduction in any medium, provided the original work is properly cited.
This article is published in open access under the Subscribe to Open model. This email address is being protected from spambots. You need JavaScript enabled to view it. to support open access publication.
1. Introduction
Fast radio bursts (FRBs) are bright radio transients that last several to tens of milliseconds and are mostly extragalactic, with a typical dispersion measure (DM) of ∼100 − 3038 pc cm−3 (Lorimer et al. 2007; Keane et al. 2012; Thornton et al. 2013; Cordes & Chatterjee 2019; Petroff et al. 2019, 2022; Bhardwaj et al. 2021; CHIME/FRB Collaboration 2021). More than 800 FRBs have been detected to date (Petroff et al. 2016; CHIME/FRB Collaboration 2021), over 60 of which exhibit repetitive behaviors (Fonseca et al. 2020; Chime/Frb Collaboration 2023)1. Similar to the spectra of one-off FRBs, the spectra of bursts from individual repeating FRB sources display significant diversity (Spitler et al. 2016; Macquart et al. 2019). However, repeating FRBs typically exhibit longer durations and narrower bandwidths than one-off FRBs (CHIME/FRB Collaboration 2021; Pleunis et al. 2021). Bursts from repeating FRB sources often exhibit complex time-frequency drift structures, and some bursts consist of several sub-bursts (Hessels et al. 2019; Zhou et al. 2022). The question of whether all FRBs are repeating remains unresolved (Caleb et al. 2019; Zhong et al. 2022).
The origin of FRBs is still unclear and widely debated (see Platts et al. 2019; Zhang 2023 for reviews). Most proposed source models involve some compact objects, such as magnetized neutron stars (Dai et al. 2016; Wang et al. 2016), young pulsars (Lyutikov et al. 2016; Lyu et al. 2021), magnetars (Lyubarsky 2014; Beloborodov 2017, 2020; Metzger et al. 2019; Lu et al. 2020), strange stars (Zhang et al. 2018a; Geng et al. 2021), and black holes (Katz 2020; Deng 2021). The detected association of magnetar SGR 1935+2154 with FRB 20200428 suggests that at least some FRBs may originate from magnetars (Bochenek et al. 2020; CHIME/FRB Collaboration 2020).
The observed spectral profiles of bursts from repeating FRBs are typically modeled with a Gaussian function (Law et al. 2017; Aggarwal et al. 2021; Zhou et al. 2022). These bursts are generally narrow-banded. For instance, the spectra of bursts emitted by FRB 20201124A have a characteristic bandwidth (Δν) of ∼0.277 GHz, with a peak frequency (νpk) of 1.09 GHz (Zhou et al. 2022). The relative spectral bandwidth Δν/νpk for 1076 bursts from FRB 20220912A, detected by the Five-hundred-meter Aperture Spherical Radio Telescope (FAST, Jiang et al. 2019), is narrowly distributed in the range (0.1∼0.2) (Zhang et al. 2023). For one burst from repeating FRB 20190711A, Δν/νpk is 0.065/1.4 (Kumar et al. 2021). These observations suggest that the narrow spectra of these typical FRBs are likely intrinsic and determined by their intrinsic radiation mechanism (Yang 2023; Wang et al. 2024).
Multiple frequency observations, particularly wideband frequency observations, are critical for understanding the radiation mechanism of FRBs. FRB 20121102A, the first detected repeating FRB source (Spitler et al. 2016), has had thousands of bursts reported by various monitoring campaigns across 0.5 − 8 GHz (e.g., Spitler et al. 2014; Gajjar et al. 2018; Zhang et al. 2018b; Houben et al. 2019; Josephy et al. 2019; Oostrum et al. 2020; Rajwade et al. 2020; Li et al. 2021; Hewitt et al. 2022). It has a typical Δν less than 500 MHz (Gajjar et al. 2018; Lyu et al. 2022). Moreover, the peak frequency of bursts observed by the Green Bank Telescope (GBT) at the C band (4 − 8 GHz) shows several discrete peaks (Gajjar et al. 2018; Zhang et al. 2018b; Lyu et al. 2022). Interestingly, when extending such a fringe spectral feature to 0.5 − 4 GHz, the bimodal burst energy distribution observed with FAST by Li et al. (2021) can be well reproduced by assuming a simple power law energy function (Lyu et al. 2022). Similar discrete peaks are also seen in the peak frequency distributions of repeating FRB sources FRB 20190520B and FRB 20201124A (Lyu & Liang 2023; Lyu et al. 2024).
The high brightness temperature (TB ≥ 1035 K) indicates that the radiation mechanism of FRBs must be coherent (Zhang 2020; Lyubarsky 2021; Xiao et al. 2021). Various hypotheses have been proposed, such as synchrotron maser radiation in relativistic shocks under strong magnetization conditions (Lyubarsky 2014; Beloborodov 2017, 2020; Metzger et al. 2019) or weak magnetization conditions (Waxman 2017) as well as vacuum conditions (Ghisellini 2017), coherent curvature radiation, coherent inverse Compton scattering, or coherent Cherenkov radiation close in the magnetosphere (Yang & Zhang 2018; Zhang 2022; Liu et al. 2023). Synchrotron maser radiation under weak magnetization conditions has a very narrow intrinsic radiation spectrum and a prominent peak (Sagiv & Waxman 2002). Inspired by the observed narrow-banded emission spectrum and the fringe pattern of the νpk distribution of repeating FRBs, we explore whether the synchrotron maser radiation mechanism of electrons in a weakly magnetized relativistic plasma can account for these spectral characteristics.
The paper is organized as follows. The model is presented in Sect. 2. The application of our model to explain the spectral characteristics of FRB 20121102A and to constrain the model parameters via Monte Carlo simulations is shown in Sect. 3. Conclusions and discussion are given in Sect. 4. Throughout the paper, we adopt a flat ΛCDM cosmology with cosmological parameters H0 = 67.7 km s−1 Mpc−1, Ωm = 0.31 (Planck Collaboration XIII 2016).
2. Model
We propose that repeating FRBs arise from a pre-accelerated plasma that relativistically moves toward observers with a bulk Lorentz factor of Γ. It may originate from a relativistic outflow powered by the central engine (e.g., Lyubarsky 2014; Waxman 2017; Metzger et al. 2019; Beloborodov 2020; Khangulyan et al. 2022). A burst episode results from plasma instability induced by ejecta injected from the activity of the central engine, such as magnetar flares. The ejecta is highly relativistic and may be dominated by Poynting flux or baryons. The interaction between the ejecta and the plasma shell generates collisionless shocks, which induce plasma instability or turbulence and form localized blobs. In case of the synchrotron maser emission conditions are satisfied in some blobs, bright FRB events with a narrow-banded spectrum can be generated by the synchrotron maser radiation of electrons in the plasma blobs (e.g., Sagiv & Waxman 2002; Waxman 2017; Gruzinov & Waxman 2019). The observed frequency-dependent depolarization may be due to the FRB emission propagation through the clumpy shell (Xu et al. 2022; Feng et al. 2022).
We show the cartoon of our model in Fig. 1. The size of the blob in the comoving frame is estimated as R′=ΓcΔt ∼ 3 × 109 cm, assuming Γ = 100 and Δt = 1 ms. The plasma frequency is given by νP = (nee2/πγeme)1/2 and the magnetization factor is defined as σ = B2/4πmec2γene = (νB/νP)2, where ne is the relativistic number density of electrons, e is the electron charge, me is the rest mass of the electron, B is the magnetic field, γe is the Lorentz factor of the electron and νB is the cyclotron frequency of the relativistic electron (Lyubarsky 2021).
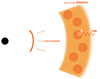 |
Fig. 1. Schematic configuration: the ejecta from the central engine triggers plasma instabilities, inducing localized electron plasma blobs that generate FRBs. |
The synchrotron radiation power of a relativistic electron in the plasma is severely suppressed for emission at ν ≲ νR*. This suppression is known as the Razin effect2. Another striking effect of synchrotron radiation in the plasma is the maser emission mechanism, which involves the amplification of radiation caused by the negative synchrotron self-absorption (Twiss 1958; McCray 1966; Zheleznyakov 1967; Sazonov 1970; Sagiv & Waxman 2002; Waxman 2017). The self-absorption coefficient for a specific polarization mode of synchrotron radiation is given by (Ginzburg 1989; Sagiv & Waxman 2002)
![Mathematical equation: $$ \begin{aligned} \alpha _\nu ^{\left[ \perp , \Vert \right]} = - \frac{1}{{4\pi {m_{\text{ e}}}{\nu ^2}}}\int d {\gamma _{\text{ e}}}\gamma _{\text{ e}}^2P_\nu ^{\left[ \perp , \Vert \right]}\left( {{\gamma _{\text{ e}}}} \right)\frac{d}{{d{\gamma _{\text{ e}}}}}\left( {\gamma _{\text{ e}}^{ - 2}\frac{{d{n_{\text{ e}}}}}{{d{\gamma _{\text{ e}}}}}} \right) \; \end{aligned} $$](/articles/aa/full_html/2025/03/aa52834-24/aa52834-24-eq1.gif) (1)
(1)
and
![Mathematical equation: $$ \begin{aligned} P_\nu ^{\left[ \perp , \Vert \right]}\left( {{\gamma _{\text{ e}}}} \right)&=\frac{\sqrt{3} \mathrm{{e^3}} { B}\sin \chi }{2 m_{\rm e} c^{2}}\left[1+\left(\frac{\nu _{\rm R}}{\nu }\right)^{2}\right]^{-1 / 2} \frac{\nu }{\tilde{\nu }_{\rm c}} \nonumber \\&\quad \times \left[\int _{\nu / \tilde{\nu }_{\rm c}}^{\infty } K_{5 / 3}(z) d z \pm K_{2 / 3}\left(\frac{\nu }{\tilde{\nu }_{\rm c}}\right)\right], \end{aligned} $$](/articles/aa/full_html/2025/03/aa52834-24/aa52834-24-eq2.gif) (2)
(2)
where Pν[⊥,∥](γe) is the radiation power per unit frequency emitted by a single electron with Lorentz factor γe in a polarization mode [⊥,∥]. Here, ⊥ and ∥ denote the linear polarization perpendicular and parallel to the projection of the magnetic field on the plane of observation, respectively. χ is the pitch angle, K5/3 and K2/3 are the modified Bessel functions, and
![Mathematical equation: $$ \begin{aligned} {\tilde{\nu }}_{\rm {c}} = \frac{{3\mathrm{{e}}B\sin \chi }}{{4\pi {m_{\rm {e}}}c}}\gamma _{\rm {e}}^2{\left[ {1 + {{\left( {\frac{{{\nu _{\rm {R}}}}}{\nu }} \right)}^2}} \right]^{ - 3/2}} \;. \end{aligned} $$](/articles/aa/full_html/2025/03/aa52834-24/aa52834-24-eq3.gif) (3)
(3)
The contribution of the negative reabsorption comes from the regions where the electron distribution function is steeper than γe2 (Sagiv & Waxman 2002; Waxman 2017; Gruzinov & Waxman 2019). McCray (1966) and Zheleznyakov (1967) discussed the possibility of negative reabsorption in cold plasma (non-relativistic plasma). However, even without cold plasma, due to the correction of n by relativistic electron plasma, negative reabsorption can occur at ν ≲ νR when γe2 ≪ σ−1/2 (Sazonov 1970). Sagiv & Waxman (2002) derived that negative reabsorption can also occur below the frequency σ−1/4νP even when γe2 > σ−1/2 > 1. Finally, it is generally believed that negative reabsorption occurs at ν ≲ νR* = νPmin{σ−1/4,γe}. Following Sagiv & Waxman (2002), Waxman (2017), negative reabsorption can arise from a narrow electron distribution. In our analysis, we assume that the electron distribution in the blobs is monoenergetic as  . Moreover, FRB 20121102A shows almost 100% linear polarization degree (Michilli et al. 2018). Therefore, the reabsorption coefficient of the radiation produced by a monoenergetic electron distribution is given as
![Mathematical equation: $$ \begin{aligned} \alpha _\nu ^{\left[ \bot \right]} = {\alpha _0}{F^{[ \bot ]}}\left[ {\gamma _{\mathrm{{e,s}} }^2{\sigma ^{1/2}},\frac{\nu }{{\nu _{\rm {R}}^*}}} \right],\quad {\alpha _0} = \frac{{\pi {\nu _{\rm P}}}}{{2\sqrt{3} c}}{\sigma ^{3/4}}\sin \chi . \end{aligned} $$](/articles/aa/full_html/2025/03/aa52834-24/aa52834-24-eq5.gif) (4)
(4)
The details of the function F[⊥] are given in Eq. (A.5) in the Appendix. We present the numerical results of our model by considering γe, s2σ1/2 values of 2, 5, 10, 20, 50, 100, and 1000, with χ = π/4. Figure 2 shows the normalized self-absorption coefficient (αν⊥/α0) as a function of the frequency in units of νR* in the comoving frame. It is observed that negative reabsorption begins at ν/νR* ∼ 0.4, independent of the γe, s2σ1/2 values. The peak negative reabsorption and the corresponding frequency are parameter dependent at γe, s2σ1/2 < 50, but they approach an asymptotic value of (αν⊥/α0) = −0.4 at ν = 0.70νR* by increasing the values of γe, s2σ1/2 up to 1000. The negative reabsorption regime is confined in the frequency range of 0.4νR* < ν < νR*. The gray solid line in Fig. 2 represents the positive self-absorption coefficient against frequency neglecting the plasma effects (The detailed calculation is shown in Eq. (A.8) in Appendix).
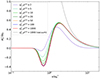 |
Fig. 2. Normalized self-absorption coefficient for ⊥ polarization, given a single-energy electron distribution and |

The radiation intensity is given by (e.g., Sagiv & Waxman 2002)
 (5)
(5)
where jν is the specific emissivity (see Appendix Eq. (A.3) for details), τν = ανΔ is the optical depth and Δ is the width of the radiating region along the line of sight. The specific emissivity of a single electron plasma blob is given as
![Mathematical equation: $$ \begin{aligned} j_\nu ^{\left[ \bot \right]} = {j_0}{G^{[ \bot ]}}\left[ {\gamma _{\mathrm{{e}},\mathrm{{s}}}^2{\sigma ^{1/2}},\frac{\nu }{{\nu _{\rm {R}}^*}}} \right],\quad {j_0} = \frac{{\pi {m_{\rm e}}}}{{2\sqrt{3} c}}\nu _{ \mathrm{P}}^3\sin \chi . \end{aligned} $$](/articles/aa/full_html/2025/03/aa52834-24/aa52834-24-eq8.gif) (6)
(6)
The details of the function G[⊥] are given in Eq. (A.6) in the Appendix. Therefore, the radiation flux density of an individual blob in the observer’s frame can be estimated as (Zhang 2018)
![Mathematical equation: $$ \begin{aligned} {F_\nu }\left( {{\nu _{\mathrm{{obs}}}}} \right) = \frac{{(1 + z){\Gamma ^3}j{{_{{\nu \prime }}\prime }^{\left[ \bot \right]}}\left( {{\nu \prime }} \right)\frac{{1 - {e^{ - \tau {{_{{\nu \prime }}\prime }^{\left[ \bot \right]}}\left( {{\nu \prime }} \right)}}}}{{\tau {{_{{\nu \prime }}\prime }^{\left[ \bot \right]}}\left( {{\nu \prime }} \right)}}{V\prime }}}{{D_{\rm {L}}^2}}, \end{aligned} $$](/articles/aa/full_html/2025/03/aa52834-24/aa52834-24-eq9.gif) (7)
(7)
where the prime means that the corresponding quantities are measured in the comoving frame, z is the redshift, V′ is the volume, and DL is the luminosity distance. The peak frequency of emission in the observer’s frame can be estimated as
 (8)
(8)
where notation Qn = Q/10n is adopted in the cgs units. In our model, the volume and optical depth of a single blob are denoted as 4πR′3/3 and αν[⊥]R′, respectively. Taking γe, s = 300, σ = 2.2 × 10⁻⁵, Γ = 100, νP = 4.5 MHz, DL = 1 Gpc (z = 0.193), and t = 1 ms, we derive the radiating spectrum as shown in the top panel of Fig. 3. Its peak frequency is νpk = 3.85 GHz and its peak flux density is Fνpk = 1.13 Jy. One can observe that the synchrotron maser emission can generate extremely narrow spectra and exceptionally bright signals (with peak flux density exceeding the emission in other bands by more than 12 orders of magnitude) at GHz frequency. For illustrating the spectral shapes in the energy bands of the GBT and Arecibo telescopes, Fig. 3 (bottom) also shows the predicted spectra above the detection thresholds of the GBT (Flimit = 0.0265 Jy) and the Arecibo telescope (Flimit = 0.057 Jy) by employing three parameter sets as marked in the panel with fixing Γ = 100. It can be observed that our model predicts the narrower spectrum with the lower peak frequency.
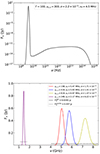 |
Fig. 3. Flux density of synchrotron radiation as a function of frequency for FRBs, assuming a monoenergetic electron population in an individual blob (top panel). The predicted “observable” burst spectral profiles under different parameters range from 1 to 8 GHz (bottom panel). |
3. Application to FRB 20121102A
The rich observational data across multiple frequencies of FRB 20121102A makes it a good candidate for exploring the radiation mechanism of FRBs. Its high brightness temperature (TB ≥ 1035 K) indicates that its radiation mechanism must be coherent. Its redshift is z = 0.193 (DL = 972 Mpc) (Tendulkar et al. 2017) and the typical burst duration is tobs = 1 ms. The distribution of burst energy ranges from 4 × 1036 to 1040 erg (Li et al. 2021). The observed spectral profile follows a Gaussian function (Law et al. 2017; Aggarwal et al. 2021). Interestingly, the distribution of peak frequency of FRB 20121102A observed with GBT at the C band exhibits a putative fringe pattern, and such a feature also seems to be seen in the observation with the Arecibo telescope at the L band (1.15 − 1.73 GHz) (Lyu et al. 2022). We analyze these spectral properties with our model through Monte Carlo simulations.
Our simulation analysis is based on the observations of the peak frequency  and the isotropic energy
  from the GBT and Arecibo telescopes. Assuming the emitting region is a pre-accelerated plasma that moves toward observers with a bulk Lorentz factor Γ = 100, we explore the model parameter set {γe, s, σ, νP} that can represent the
  and
and  distributions observed with the GBT and Arecibo telescopes. Below, we outline our simulation procedure for the GBT observation.
-
We generate a
 value from the
  distribution observed by the GBT (Gajjar et al. 2018; Zhang et al. 2018b). Lyu et al. (2022) fitted the
  distribution with a multi-Gaussian function. We adopt the fitting results from Lyu et al. (2022) and generate
  based on the derived probability distribution.
 -
We generate a set of {γe, s, σ} assuming that they are uniformly distributed in the range of γe, s ∈ [2, 103] and
 , where the distribution range of σ is derived from the weak magnetization condition (γe, s2 > σ−1/2 > 1). When γe, s2σ1/2 > 50, we calculate the νP value with Eq. (8). We calculate the simulated peak flux density
  at
at  with Eq. (7) for the parameter set of {γe, s, σ, νP}. We check whether the
  value is in the range of
  as observed with GBT. If it does, we choose the parameter set and proceed to the next step. Otherwise, we discard this parameter set and repeat this step.
 -
We calculate the burst isotropic energy with
where Δt is the burst duration. Our analysis takes the typical value with Δt = 1 ms.
-
We repeat the above steps to generate a sample of 5 × 10⁴ bursts, then extract a sub-sample of 8 × 10³ bursts by utilizing the accumulated probability distribution function
![Mathematical equation: $ \left[\psi\left(E_\mathrm{{iso}}^\mathrm{{obs}}\right)\right] $](/articles/aa/full_html/2025/03/aa52834-24/aa52834-24-eq25.gif) for
for  . To do so, we generate 8 × 10³ random numbers in the range of (0,1) and set them as the values of ψ, then identify the corresponding
  values with the inverse function of
  .
.
Each simulated burst is characterized by  . The parameters of the plasma, namely γe, s, σ, and νP, are constrained by the consistency of the νpk and Eiso distributions between the observed and simulated samples. Similarly, we also simulate the Arecibo telescope observations (Hewitt et al. 2022) with the same approach. We select only those bursts whose high (νhigh) and low (νlow) frequencies are available because the main emission of these bursts is detected within the bandwidth of the Arecibo telescope. Since the peak flux density of these bursts is not presented in Hewitt et al. (2022), we use the observed fluence in a 1 ms peak time as a proxy for the peak flux density. Figure 4 compares the distributions of νpk and Eiso between the observed and simulated samples. We measure their consistency with the Kolmogorov-Smirnov test. The derived p-values are larger than 0.1, indicating that the distributions of νpk and Eiso between the simulated and observed samples are statistically consistent.
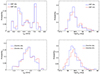 |
Fig. 4. Comparison of the peak frequency νpk and isotropic energy Eiso distributions between the simulated and observed samples, where the data of the observed samples are taken from Lyu et al. (2022). |
Figure 5 illustrates the histograms of the model parameters derived from our analysis. For the bursts in the 4 − 8 GHz band, the γe, s is uniformly distributed in the range of 110 < γe, s < 1000, and the distribution of σ ranges from 9 × 10⁻⁶ to 2 × 10⁻⁵. For the bursts in the 1.15 − 1.73 GHz band, the γe, s is uniformly distributed in the range of 80 < γe, s < 1000, and the distribution of σ ranges from 4.7 × 10⁻⁵ to 7.4 × 10⁻⁵. The distribution of νP shows several peaks in the range from  (νP = 5.00 MHz) to
  (νP = 7.5 MHz) for the bursts observed with the GBT, and a narrow peak around
  (2.2 MHz) for the bursts observed with the Arecibo telescope. The log νP distribution is similar to the
  distribution, suggesting that the
  of a burst is sensitive to νP, hence to the relativistic electron number density in the radiating region.
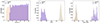 |
Fig. 5. Histograms of the model parameters γe, s, σ and νP derived from our simulation analysis. |
4. Conclusions and discussion
This paper proposes that repeating FRBs arise from synchrotron maser radiation produced by a series of local electron plasma blobs in a weakly magnetized relativistic plasma, which are induced by plasma instabilities triggered by the injected ejecta from the central engine. We present the numerical calculation of the synchrotron maser radiation spectrum in FRBs, assuming a monoenergetic electron population within an individual blob. The negative reabsorption is toward a maximum at frequency νmax = 0.70Γσ−1/4νP if γe, s2σ1/2 > 50. The peak flux density of synchrotron maser emission is Fνpk∼ Jy and the corresponding νpk is at several GHz, if σ ∼ 10−5, γe, s > 100, νP > 2 MHz, and Γ = 100. Our model predicts that FRBs with lower peak frequencies have narrower intrinsic radiation spectra. We utilize our model to account for the observed νpk and Eiso characteristics of FRB 20121102A observed with the GBT and the Arecibo telescopes. Our analysis reveals that the νP distribution exhibits several peaks, which is similar to the  distributions. This implies that the
  of a burst is sensitive to νP, which represents the relativistic electron number density.
The synchrotron maser radiations result from the negative synchrotron self-absorption if the refractive index of the relativistic plasma is less than unity. It should be noted that the refractive index in a relativistic plasma depends on the energy and angular distribution of particles (Aleksandrov et al. 1984). In a weakly magnetized relativistic plasma environment, the refractive index of  is valid for monoenergetic distribution and power law distribution of the electrons (Sagiv & Waxman 2002). Additionally, we can use the numerical results of the reabsorption coefficient to test the self-consistency of our calculations. As shown in Ginzburg (1989) and Sagiv & Waxman (2002), synchrotron maser emission is linearly polarized, if the conditions of |1−n| ≫ |cαν/ν| and
  are satisfied, where
  represents the difference in the refractive index between the circularly polarized modes introduced by the magnetic field. The synchrotron maser emission sharply peaks at ν ∼ 0.70νR*. Thus, we have
  , Δn ∼ νP2νB/ν3 = 2.91σ5/4, and ανc/ν = 0.37σ. Our analysis yields σ ∼ 10−5, indicating that these conditions are met. Thus, the maser emission is linearly polarized consistent with the observation of FRB 20121102A (Michilli et al. 2018).
The Δν in the sample observed with the Arecibo telescope is available. We also calculate the simulated Δν for the Arecibo sample and compare its distribution with the observed ones in Fig. 6. It was found that they have similar distribution profiles, but the simulated Δν distribution peaks at 0.2 GHz, while the observed peaks at 0.3 GHz. This discrepancy is possibly due to the propagation process broadening the spectra.
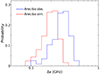 |
Fig. 6. Comparison of the spectral width Δν of the observed sample detected by Arecibo telescope in Hewitt et al. (2022) with the simulated ones. |
FRB 20121102A is located in a star-forming region of a dwarf galaxy (Tendulkar et al. 2017), and in an extremely dynamic magnetized ionized environment (high Faraday rotation measure RM ∼ 105 rad m−2, Michilli et al. 2018). It is spatially associated with a compact, persistent radio source (PRS) (Chatterjee et al. 2017). It also has a possible periodicity of approximately 160 days (Rajwade et al. 2020; Cruces et al. 2021). Our analysis suggests that the synchrotron maser emission for FRB 20121102A is stimulated in a weakly magnetized region (σ ∼ 10−5). A small σ is primarily caused by a high relativistic electron number density. We approximate the electron population for generating the synchrotron maser emission as single- energy electrons and the derived relativistic electron density of ne = 106 ∼ 108 cm−3. The hot corona region around accretion disk near compact objects (e.g., Gruzinov & Waxman 2019), in a binary system where compact stars undergo an accretion-induced explosion or episodic jets caused by accretion (e.g., Long & Pe’er 2018; Deng et al. 2021), or in flare of weakly magnetized material generated by magnetars (Khangulyan et al. 2022), can offer such an environment.
The distribution of νpk observed in FRB 20121102A displays a fringe pattern3. Our model explains the observed fringe pattern with the inhomogeneity of relativistic electron density in plasma blobs. We note that Feng et al. (2022) suggested that the significant frequency-dependent depolarization at frequencies lower than 3.5 GHz in FRB 20121102A is caused by multipath propagation of the FRB emission through an inhomogenous magnetic-ionic environment. The νpk distribution of FRB 20201102A is similar to the zebra radio spectrum typically seen in individual radio bursts emitted by the Sun and Crab (Hankins & Eilek 2007; Karlický 2013). The zebra radio spectra of the solar or Crab radiations may also arise from a plasma radiation mechanism driven by uneven plasma density. Karlický (2013) proposed that the plasma density accumulation in different regions could be modulated by the magnetohydrodynamic waves in the radiation region. In addition, some energy release processes may form traps that can confine the plasma, similar to the magnetic trap proposed by Kong et al. (2019). Furthermore, if low-density cavities exist within the plasma, they could impose a discrete frequency structure on the radiation (Hankins et al. 2016).
The extensively discussed radiation models of FRBs can generally be divided into two categories: the “close-in” scenario, where the emission originates from coherent curvature radiation in the magnetosphere of magnetars (e.g., Kumar et al. 2017; Yang & Zhang 2018; Lu et al. 2020), and the “far-away” scenario, where the emission originates from synchrotron maser radiation in a relativistic outflow (e.g., Lyubarsky 2014; Waxman 2017; Metzger et al. 2019; Beloborodov 2020; Khangulyan et al. 2022). Our model is similar to the far-away scenario. Our model suggests that the inhomogeneity of the local relativistic plasma blobs is stimulated by the injection from the central engine. In our model, the ejecta is required to be highly relativistic, and it is likely similar to the magnetar flares from an active magnetar (Lyubarsky 2014; Metzger et al. 2019; Khangulyan et al. 2022).
Some repeating FRB sources show complex polarization behaviors, including frequency-dependent depolarization, variation of RM, and oscillating spectral structures of polarized components (Feng et al. 2022). As reported by Feng et al. (2022), the observed frequency-dependent depolarization and correlation between RM scatter and the temporal scattering time can be explained by multiple-path propagation through a complex environment, such as a supernova remnant-like, inhomogeneous, magnetized plasma screen (nebula) close to a repeating FRB source (Yang et al. 2022). This suggests that the temporal scattering and RM scatter originate from the same site. The model proposed by Yang et al. (2022) attributes the observed polarization variation to the propagation of the FRB emission in the nebula. They also suggested that the nebula can be responsible for the associated PRS emission. Differently, we argue that the outbursts and propagation of FRB bursts are in the same site, which is an inhomogeneous, weakly-magnetized plasma shell.
The repeating behavior of FRBs is attributed to the episodic activity of the central engine in the framework of our model (e.g., Metzger et al. 2019). Observations show that the duration of an outburst episode lasts from days to several months and the burst rates are erratic. For example, FRB 20201124A is a very active FRB. The follow-up observation with the FAST telescope detected a significant activity, with the detection of 1863 bursts in a period from April 1 to June 11, 2021 (Xu et al. 2022). Four months later, another active episode was also observed by FAST with detection of over 600 bursts in a period of 4 days (Zhou et al. 2022; Zhang et al. 2022; Jiang et al. 2022; Niu et al. 2022). Interestingly, comparison of the observed burst property distributions between the two burst episodes, including the spectral width, burst energy, and peak frequency, shows that they are statistically consistent. This may hint the bursts of the two episodes are from the same radiating region.
The synchrotron emission beaming angle of a relativistic electron in the plasma is given by  , where n represents the refractive index (n2 ≈ 1 − νP2/ν2 ≠ 1) and β is the velocity of the electron in units of speed of the light (Rybicki & Lightman 1986). In the case of β ≈ 1, we have
  , indicating that the beaming angle depends on both the emission frequency and plasma frequency. For a certain emission frequency below νR (the so-called Razin frequency γeνP), its beaming angle is significantly larger than that in the vacuum, νP/ν ≫ 1/γe, resulting in a significant weakening of the beaming effect (McCray 1966; Rybicki & Lightman 1986). Furthermore, Sagiv & Waxman (2002) generalized the typical frequency at which the beaming effect is weakened to ν ≲ νR* = νPmin{σ−1/4,γe}, where νR* is the modified Razin frequency.
Notably, the spectral fringe feature, observed within the range of 4 − 8 GHz, was derived from a statistical analysis of 93 bursts observed in 6 hours. Despite extensive multiwavelength monitoring campaigns have been conducted on FRB 20121102A using various telescopes (e.g., Scholz et al. 2016; Law et al. 2017; Gourdji et al. 2019; Houben et al. 2019; Pearlman et al. 2020), only one burst was simultaneously detected by Arecibo at 1.4 GHz and VLA at 3 GHz (Law et al. 2017).
Acknowledgments
We thank the anonymous referee for helpful comments. We thank the helpful discussions with Yuan-Pei Yang, Yao Chen, Shu-Qing Zhong, Qi Wang and Ying Gu. We acknowledge the use of the public data from the FAST/FRB Key Project. This work is supported by National Key R&D Program (2024YFA1611700) and the National Natural Science Foundation of China (grant Nos. 12403042, 12133003, 12203013 and 12203022). E. W. L. is supported by the Guangxi Talent Program (“Highland of Innovation Talents”).
References
- Aggarwal, K., Agarwal, D., Lewis, E. F., et al. 2021, ApJ, 922, 115 [CrossRef] [Google Scholar]
- Aleksandrov, A. F., Bogdankevich, L. S., & Rukhadze, A. A. 1984, Berlin and New York, 2444 [Google Scholar]
- Beloborodov, A. M. 2017, ApJ, 843, L26 [NASA ADS] [CrossRef] [Google Scholar]
- Beloborodov, A. M. 2020, ApJ, 896, 142 [NASA ADS] [CrossRef] [Google Scholar]
- Bhardwaj, M., Gaensler, B. M., Kaspi, V. M., et al. 2021, ApJ, 910, L18 [NASA ADS] [CrossRef] [Google Scholar]
- Bochenek, C. D., Ravi, V., Belov, K. V., et al. 2020, Nature, 587, 59 [NASA ADS] [CrossRef] [Google Scholar]
- Caleb, M., Stappers, B. W., Rajwade, K., & Flynn, C. 2019, MNRAS, 484, 5500 [NASA ADS] [CrossRef] [Google Scholar]
- Chatterjee, S., Law, C. J., Wharton, R. S., et al. 2017, Nature, 541, 58 [NASA ADS] [CrossRef] [Google Scholar]
- CHIME/FRB Collaboration (Andersen, B. C., et al.) 2020, Nature, 587, 54 [Google Scholar]
- CHIME/FRB Collaboration (Amiri, M., et al.) 2021, ApJS, 257, 59 [NASA ADS] [CrossRef] [Google Scholar]
- Chime/Frb Collaboration (Andersen, B. C., et al.) 2023, ApJ, 947, 83 [NASA ADS] [CrossRef] [Google Scholar]
- Cordes, J. M., & Chatterjee, S. 2019, ARA&A, 57, 417 [NASA ADS] [CrossRef] [Google Scholar]
- Cruces, M., Spitler, L. G., Scholz, P., et al. 2021, MNRAS, 500, 448 [Google Scholar]
- Dai, Z. G., Wang, J. S., Wu, X. F., & Huang, Y. F. 2016, ApJ, 829, 27 [NASA ADS] [CrossRef] [Google Scholar]
- Deng, C.-M. 2021, Phys. Rev. D, 103, 123030 [NASA ADS] [CrossRef] [Google Scholar]
- Deng, C.-M., Zhong, S.-Q., & Dai, Z.-G. 2021, ApJ, 922, 98 [NASA ADS] [CrossRef] [Google Scholar]
- Feng, Y., Li, D., Yang, Y.-P., et al. 2022, Science, 375, 1266 [NASA ADS] [CrossRef] [Google Scholar]
- Fonseca, E., Andersen, B. C., Bhardwaj, M., et al. 2020, ApJ, 891, L6 [NASA ADS] [CrossRef] [Google Scholar]
- Gajjar, V., Siemion, A. P. V., Price, D. C., et al. 2018, ApJ, 863, 2 [NASA ADS] [CrossRef] [Google Scholar]
- Geng, J., Li, B., & Huang, Y. 2021, The Innovation, 2, 100152 [NASA ADS] [CrossRef] [Google Scholar]
- Ghisellini, G. 2017, MNRAS, 465, L30 [CrossRef] [Google Scholar]
- Ginzburg, V. L. 1989, Applications of Electrodynamics in Theoretical Physics and Astrophysics (New York, NY, USA: Gordon and Breach) [Google Scholar]
- Gourdji, K., Michilli, D., Spitler, L. G., et al. 2019, ApJ, 877, L19 [NASA ADS] [CrossRef] [Google Scholar]
- Gruzinov, A., & Waxman, E. 2019, ApJ, 875, 126 [NASA ADS] [Google Scholar]
- Hankins, T. H., & Eilek, J. A. 2007, ApJ, 670, 693 [Google Scholar]
- Hankins, T. H., Eilek, J. A., & Jones, G. 2016, ApJ, 833, 47 [NASA ADS] [CrossRef] [Google Scholar]
- Hessels, J. W. T., Spitler, L. G., Seymour, A. D., et al. 2019, ApJ, 876, L23 [Google Scholar]
- Hewitt, D. M., Snelders, M. P., Hessels, J. W. T., et al. 2022, MNRAS, 515, 3577 [NASA ADS] [CrossRef] [Google Scholar]
- Houben, L. J. M., Spitler, L. G., ter Veen, S., et al. 2019, A&A, 623, A42 [NASA ADS] [CrossRef] [EDP Sciences] [Google Scholar]
- Jiang, P., Yue, Y., Gan, H., et al. 2019, Sci. China Phys., Mech. Astron., 62, 959502 [CrossRef] [Google Scholar]
- Jiang, J.-C., Wang, W.-Y., Xu, H., et al. 2022, Res. Astron. Astrophys., 22, 124003 [CrossRef] [Google Scholar]
- Josephy, A., Chawla, P., Fonseca, E., et al. 2019, ApJ, 882, L18 [NASA ADS] [CrossRef] [Google Scholar]
- Karlický, M. 2013, A&A, 552, A90 [NASA ADS] [CrossRef] [EDP Sciences] [Google Scholar]
- Katz, J. I. 2020, MNRAS, 494, L64 [NASA ADS] [CrossRef] [Google Scholar]
- Keane, E. F., Stappers, B. W., Kramer, M., & Lyne, A. G. 2012, MNRAS, 425, L71 [NASA ADS] [CrossRef] [Google Scholar]
- Khangulyan, D., Barkov, M. V., & Popov, S. B. 2022, ApJ, 927, 2 [NASA ADS] [CrossRef] [Google Scholar]
- Kong, X., Guo, F., Chen, Y., & Giacalone, J. 2019, ApJ, 883, 49 [NASA ADS] [CrossRef] [Google Scholar]
- Kumar, P., Lu, W., & Bhattacharya, M. 2017, MNRAS, 468, 2726 [NASA ADS] [CrossRef] [Google Scholar]
- Kumar, P., Shannon, R. M., Flynn, C., et al. 2021, MNRAS, 500, 2525 [Google Scholar]
- Law, C. J., Abruzzo, M. W., Bassa, C. G., et al. 2017, ApJ, 850, 76 [Google Scholar]
- Li, D., Wang, P., Zhu, W. W., et al. 2021, Nature, 598, 267 [CrossRef] [Google Scholar]
- Liu, Z.-N., Geng, J.-J., Yang, Y.-P., Wang, W.-Y., & Dai, Z.-G. 2023, ApJ, 958, 35 [NASA ADS] [CrossRef] [Google Scholar]
- Long, K., & Pe’er, A. 2018, ApJ, 864, L12 [NASA ADS] [Google Scholar]
- Lorimer, D. R., Bailes, M., McLaughlin, M. A., Narkevic, D. J., & Crawford, F. 2007, Science, 318, 777 [Google Scholar]
- Lu, W., Kumar, P., & Zhang, B. 2020, MNRAS, 498, 1397 [NASA ADS] [CrossRef] [Google Scholar]
- Lyu, F., & Liang, E.-W. 2023, MNRAS, 522, 5600 [NASA ADS] [CrossRef] [Google Scholar]
- Lyu, F., Meng, Y.-Z., Tang, Z.-F., et al. 2021, Front. Phys., 16, 24503 [NASA ADS] [CrossRef] [Google Scholar]
- Lyu, F., Cheng, J.-G., Liang, E.-W., et al. 2022, ApJ, 941, 127 [NASA ADS] [CrossRef] [Google Scholar]
- Lyu, F., Liang, E.-W., & Li, D. 2024, ApJ, 966, 115 [NASA ADS] [CrossRef] [Google Scholar]
- Lyubarsky, Y. 2014, MNRAS, 442, L9 [Google Scholar]
- Lyubarsky, Y. 2021, Universe, 7, 56 [NASA ADS] [CrossRef] [Google Scholar]
- Lyutikov, M., Burzawa, L., & Popov, S. B. 2016, MNRAS, 462, 941 [CrossRef] [Google Scholar]
- Macquart, J. P., Shannon, R. M., Bannister, K. W., et al. 2019, ApJ, 872, L19 [NASA ADS] [CrossRef] [Google Scholar]
- McCray, R. 1966, Science, 154, 1320 [NASA ADS] [CrossRef] [Google Scholar]
- Metzger, B. D., Margalit, B., & Sironi, L. 2019, MNRAS, 485, 4091 [NASA ADS] [CrossRef] [Google Scholar]
- Michilli, D., Seymour, A., Hessels, J. W. T., et al. 2018, Nature, 553, 182 [Google Scholar]
- Niu, J.-R., Zhu, W.-W., Zhang, B., et al. 2022, Res. Astron. Astrophys., 22, 124004 [CrossRef] [Google Scholar]
- Oostrum, L. C., Maan, Y., van Leeuwen, J., et al. 2020, A&A, 635, A61 [NASA ADS] [CrossRef] [EDP Sciences] [Google Scholar]
- Pearlman, A. B., Majid, W. A., Prince, T. A., et al. 2020, ApJ, 905, L27 [NASA ADS] [CrossRef] [Google Scholar]
- Petroff, E., Barr, E. D., Jameson, A., et al. 2016, PASA, 33, e045 [NASA ADS] [CrossRef] [Google Scholar]
- Petroff, E., Hessels, J. W. T., & Lorimer, D. R. 2019, A&ARv, 27, 4 [NASA ADS] [CrossRef] [Google Scholar]
- Petroff, E., Hessels, J. W. T., & Lorimer, D. R. 2022, A&ARv, 30, 2 [NASA ADS] [CrossRef] [Google Scholar]
- Planck Collaboration XIII. 2016, A&A, 594, A13 [NASA ADS] [CrossRef] [EDP Sciences] [Google Scholar]
- Platts, E., Weltman, A., Walters, A., et al. 2019, Phys. Rep., 821, 1 [NASA ADS] [CrossRef] [Google Scholar]
- Pleunis, Z., Good, D. C., Kaspi, V. M., et al. 2021, ApJ, 923, 1 [NASA ADS] [CrossRef] [Google Scholar]
- Rajwade, K. M., Mickaliger, M. B., Stappers, B. W., et al. 2020, MNRAS, 495, 3551 [NASA ADS] [CrossRef] [Google Scholar]
- Rybicki, G. B., & Lightman, A. P. 1986, Radiative Processes in Astrophysics, 382 [Google Scholar]
- Sagiv, A., & Waxman, E. 2002, ApJ, 574, 861 [NASA ADS] [CrossRef] [Google Scholar]
- Sazonov, V. N. 1970, Soviet Ast., 13, 797 [NASA ADS] [Google Scholar]
- Scholz, P., Spitler, L. G., Hessels, J. W. T., et al. 2016, ApJ, 833, 177 [CrossRef] [Google Scholar]
- Spitler, L. G., Cordes, J. M., Hessels, J. W. T., et al. 2014, ApJ, 790, 101 [NASA ADS] [CrossRef] [Google Scholar]
- Spitler, L. G., Scholz, P., Hessels, J. W. T., et al. 2016, Nature, 531, 202 [NASA ADS] [CrossRef] [Google Scholar]
- Tendulkar, S. P., Bassa, C. G., Cordes, J. M., et al. 2017, ApJ, 834, L7 [NASA ADS] [CrossRef] [Google Scholar]
- Thornton, D., Stappers, B., Bailes, M., et al. 2013, Science, 341, 53 [NASA ADS] [CrossRef] [Google Scholar]
- Twiss, R. Q. 1958, Aust. J. Phys., 11, 564 [NASA ADS] [CrossRef] [Google Scholar]
- Wang, J.-S., Yang, Y.-P., Wu, X.-F., Dai, Z.-G., & Wang, F.-Y. 2016, ApJ, 822, L7 [NASA ADS] [CrossRef] [Google Scholar]
- Wang, W.-Y., Yang, Y.-P., Li, H.-B., Liu, J., & Xu, R. 2024, A&A, 685, A87 [NASA ADS] [CrossRef] [EDP Sciences] [Google Scholar]
- Waxman, E. 2017, ApJ, 842, 34 [NASA ADS] [CrossRef] [Google Scholar]
- Wild, J. P., Smerd, S. F., & Weiss, A. A. 1963, ARA&A, 1, 291 [NASA ADS] [CrossRef] [Google Scholar]
- Xiao, D., Wang, F., & Dai, Z. 2021, Sci. China Phys., Mech. Astron., 64, 249501 [CrossRef] [Google Scholar]
- Xu, H., Niu, J. R., Chen, P., et al. 2022, Nature, 609, 685 [NASA ADS] [CrossRef] [Google Scholar]
- Yang, Y.-P. 2023, ApJ, 956, 67 [NASA ADS] [CrossRef] [Google Scholar]
- Yang, Y.-P., & Zhang, B. 2018, ApJ, 868, 31 [NASA ADS] [CrossRef] [Google Scholar]
- Yang, Y.-P., Lu, W., Feng, Y., Zhang, B., & Li, D. 2022, ApJ, 928, L16 [NASA ADS] [CrossRef] [Google Scholar]
- Zhang, B. 2018, The Physics of Gamma-Ray Bursts (Cambridge University Press) [Google Scholar]
- Zhang, B. 2020, Nature, 587, 45 [CrossRef] [Google Scholar]
- Zhang, B. 2022, ApJ, 925, 53 [NASA ADS] [CrossRef] [Google Scholar]
- Zhang, B. 2023, Rev. Mod. Phys., 95, 035005 [NASA ADS] [CrossRef] [Google Scholar]
- Zhang, Y., Geng, J.-J., & Huang, Y.-F. 2018a, ApJ, 858, 88 [NASA ADS] [Google Scholar]
- Zhang, Y. G., Gajjar, V., Foster, G., et al. 2018b, ApJ, 866, 149 [NASA ADS] [CrossRef] [Google Scholar]
- Zhang, Y.-K., Wang, P., Feng, Y., et al. 2022, Res. Astron. Astrophys., 22, 124002 [CrossRef] [Google Scholar]
- Zhang, Y.-K., Li, D., Zhang, B., et al. 2023, ApJ, 955, 142 [NASA ADS] [CrossRef] [Google Scholar]
- Zheleznyakov, V. V. 1967, Sov. J. Exp. Theor. Phys., 24, 381 [NASA ADS] [Google Scholar]
- Zhong, S.-Q., Xie, W.-J., Deng, C.-M., et al. 2022, ApJ, 926, 206 [NASA ADS] [CrossRef] [Google Scholar]
- Zhou, D. J., Han, J. L., Zhang, B., et al. 2022, Res. Astron. Astrophys., 22, 124001 [CrossRef] [Google Scholar]
Appendix A: Synchrotron self-absorption and the possibility of negative reabsorption
The synchrotron self-absorption coefficient obtained by the Einstein coefficient method is (Twiss 1958; Wild et al. 1963):
![Mathematical equation: $$ \begin{aligned} \alpha _\nu ^{\left[ p \right]} = - \frac{1}{{4\pi {m_{\text{ e}}}{\nu ^2}}}\int d {\gamma _{\text{ e}}}\gamma _{\text{ e}}^2P_\nu ^{\left[ p \right]}\left( {{\gamma _{\text{ e}}}} \right)\frac{d}{{d{\gamma _{\text{ e}}}}}\left( {\gamma _{\text{ e}}^{ - 2}\frac{{d{n_{\text{ e}}}}}{{d{\gamma _{\text{ e}}}}}} \right)\;. \end{aligned} $$](/articles/aa/full_html/2025/03/aa52834-24/aa52834-24-eq43.gif) (A.1)
(A.1)
Another expression is obtained according to integration by parts (Zheleznyakov 1967)
![Mathematical equation: $$ \begin{aligned} \alpha _\nu ^{\left[ p \right]} = \frac{1}{{4\pi {m_{\text{ e}}}{\nu ^2}}}\int d {\gamma _{\text{ e}}}\gamma _{\text{ e}}^{ - 2}\frac{{d{n_{\text{ e}}}}}{{d{\gamma _{\text{ e}}}}}\frac{d}{{d{\gamma _{\text{ e}}}}}\left( {\gamma _{\text{ e}}^2P_\nu ^{\left[ p \right]}\left( {{\gamma _{\text{ e}}}} \right)} \right) \; \end{aligned} $$](/articles/aa/full_html/2025/03/aa52834-24/aa52834-24-eq44.gif) (A.2)
(A.2)
and the specific emissivity is defined as
![Mathematical equation: $$ \begin{aligned} j_\nu ^{\left[ p \right]} = \int {\frac{{P_\nu ^{\left[ p \right]}({\gamma _{\rm {e}}})}}{{4\pi }}\frac{{d{n_{\rm {e}}}}}{{d{\gamma _{\rm {e}}}}}} d{\gamma _{\rm {e}}}\;, \end{aligned} $$](/articles/aa/full_html/2025/03/aa52834-24/aa52834-24-eq45.gif) (A.3)
(A.3)
where ν is the frequency, γe is the Lorentz factor of the electron, Pν[p](γe) is the radiation power per unit frequency emitted by a single electron with Lorentz factor γe in a polarization [p], and  is the isotropic distribution function of electrons. When the effect of plasma is considered,
![Mathematical equation: $$ \begin{aligned} P_{\nu }^{[p]}\left(\gamma _{ \mathrm e}\right)=\frac{2 \pi \mathrm{e}^{2} \nu _{c}}{\sqrt{3} \gamma _{\rm e}^{2} c} S_{\nu }^{-1 / 2}\left(\gamma _{\rm e}\right)\left[x f^{[p]}(x)\right]_{x=S_{\nu }^{3 / 2} \nu / \nu _{c}} \end{aligned} $$](/articles/aa/full_html/2025/03/aa52834-24/aa52834-24-eq47.gif) (A.4)
(A.4)
with
![Mathematical equation: $$ f^{[\perp , \Vert ]}(x)= \pm K_{2 / 3}(x)+\int _{x}^{\infty } d y K_{5 / 3}(y)\; , $$](/articles/aa/full_html/2025/03/aa52834-24/aa52834-24-eq48.gif)

and χ is the electron pitch angle, K5/3 and K2/3 is the modified Bessel function. In the case of electron distribution as a delta function,  , the self-absorption coefficient can be estimated as (Waxman 2017)
![Mathematical equation: $$ \begin{aligned} \alpha _\nu ^{[p]}(g,y) = 2{\alpha _0}{y^{ - 3}}\left[ {{f^{[p]}}(x) + \left( {\frac{1}{2} - \frac{{{y^2}}}{g}} \right)x\frac{{df(x)^{[p]}}}{{dx}}} \right]\; \end{aligned} $$](/articles/aa/full_html/2025/03/aa52834-24/aa52834-24-eq51.gif) (A.5)
(A.5)
with
and the specific emissivity can be estimated as
![Mathematical equation: $$ \begin{aligned} j_\nu ^{\left[ p \right]}(g,y) = {j_0}{(1 + \frac{g}{{{y^2}}})^{ - 1/2}}g\left[ {x{f^{\left[ p \right]}}\left( x \right)} \right] \end{aligned} $$](/articles/aa/full_html/2025/03/aa52834-24/aa52834-24-eq53.gif) (A.6)
(A.6)
with
When the effect of plasma is ignored, as in the case of a vacuum,
![Mathematical equation: $$ \begin{aligned} P{{_\nu ^{[p]}}^\prime }\left( {{\gamma _{\rm e}}} \right) = \frac{{2\pi {\mathrm{e}^2}{\nu _{c}^\prime }}}{{\sqrt{3} \gamma _{\rm e}^2c}}{\left[ {x^\prime {f^{[p]}}(x^\prime )} \right]_{x^\prime = \nu /{\nu _{c}^\prime }}} \end{aligned} $$](/articles/aa/full_html/2025/03/aa52834-24/aa52834-24-eq55.gif) (A.7)
(A.7)
with
![Mathematical equation: $$ f^{[p]}(x^\prime )= \pm K_{2 / 3}(x^\prime )+\int _{x^\prime }^{\infty } d y K_{5 / 3}(y) \;, $$](/articles/aa/full_html/2025/03/aa52834-24/aa52834-24-eq56.gif)
and χ is the electron pitch angle, K5/3 and K2/3 is the modified Bessel function. The self-absorption coefficient produced by the electron distribution as a delta function can be estimated as
![Mathematical equation: $$ \begin{aligned} \alpha {_\nu ^{[p]} }^\prime (g,y) = 2{\alpha _0}^\prime {y^{ - 3}}\left[ { - \frac{{{y^2}}}{g}x^{\prime }{\frac{df(x^{\prime })^{[p]}}{dx^{\prime }} }} \right] \end{aligned} $$](/articles/aa/full_html/2025/03/aa52834-24/aa52834-24-eq58.gif) (A.8)
(A.8)
with
where  ,
,  ,
,  , νB is the cyclotron frequency of relativistic electrons, νP is the relativistic plasma frequency.
All Figures
|
Fig. 1. Schematic configuration: the ejecta from the central engine triggers plasma instabilities, inducing localized electron plasma blobs that generate FRBs. |
| In the text | |
|
Fig. 2. Normalized self-absorption coefficient for ⊥ polarization, given a single-energy electron distribution and |
| In the text | |
|
Fig. 3. Flux density of synchrotron radiation as a function of frequency for FRBs, assuming a monoenergetic electron population in an individual blob (top panel). The predicted “observable” burst spectral profiles under different parameters range from 1 to 8 GHz (bottom panel). |
| In the text | |
|
Fig. 4. Comparison of the peak frequency νpk and isotropic energy Eiso distributions between the simulated and observed samples, where the data of the observed samples are taken from Lyu et al. (2022). |
| In the text | |
|
Fig. 5. Histograms of the model parameters γe, s, σ and νP derived from our simulation analysis. |
| In the text | |
|
Fig. 6. Comparison of the spectral width Δν of the observed sample detected by Arecibo telescope in Hewitt et al. (2022) with the simulated ones. |
| In the text | |
Current usage metrics show cumulative count of Article Views (full-text article views including HTML views, PDF and ePub downloads, according to the available data) and Abstracts Views on Vision4Press platform.
Data correspond to usage on the plateform after 2015. The current usage metrics is available 48-96 hours after online publication and is updated daily on week days.
Initial download of the metrics may take a while.