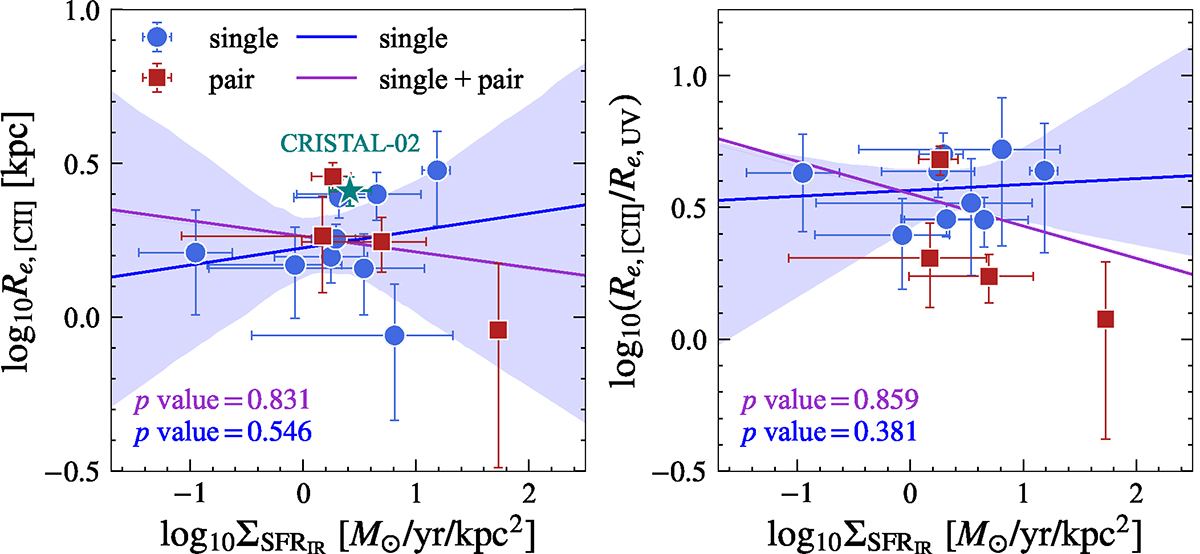
Fig. 9.
Download original image
Dependence of the spatial extent of [C II] line emission on the SFRIR surface density. (Left) [C II] line radius as a function of the SFRIR surface density. The solid blue and purple lines show a best-fit linear regression for single and single+pair sources, respectively. The shaded region shows a 95% confidence level of the fit for single galaxies. The p values of a Spearman’s rank correlation test for both single and single+pair parent samples are shown in the lower-left corner. We also highlight CRISTAL-02 (multiple-UV), a galaxy which shows an evidence of broad [C II] wing component in multiple spatially resolved elements of the galaxy (Davies et al. in prep). (Right) Same as the left panel, but taking the [C II]-to-UV size ratio as the vertical axis. Given the p values, we cannot rule out the null hypothesis that there is no correlation between these parameters.
Current usage metrics show cumulative count of Article Views (full-text article views including HTML views, PDF and ePub downloads, according to the available data) and Abstracts Views on Vision4Press platform.
Data correspond to usage on the plateform after 2015. The current usage metrics is available 48-96 hours after online publication and is updated daily on week days.
Initial download of the metrics may take a while.