Fig. 7.
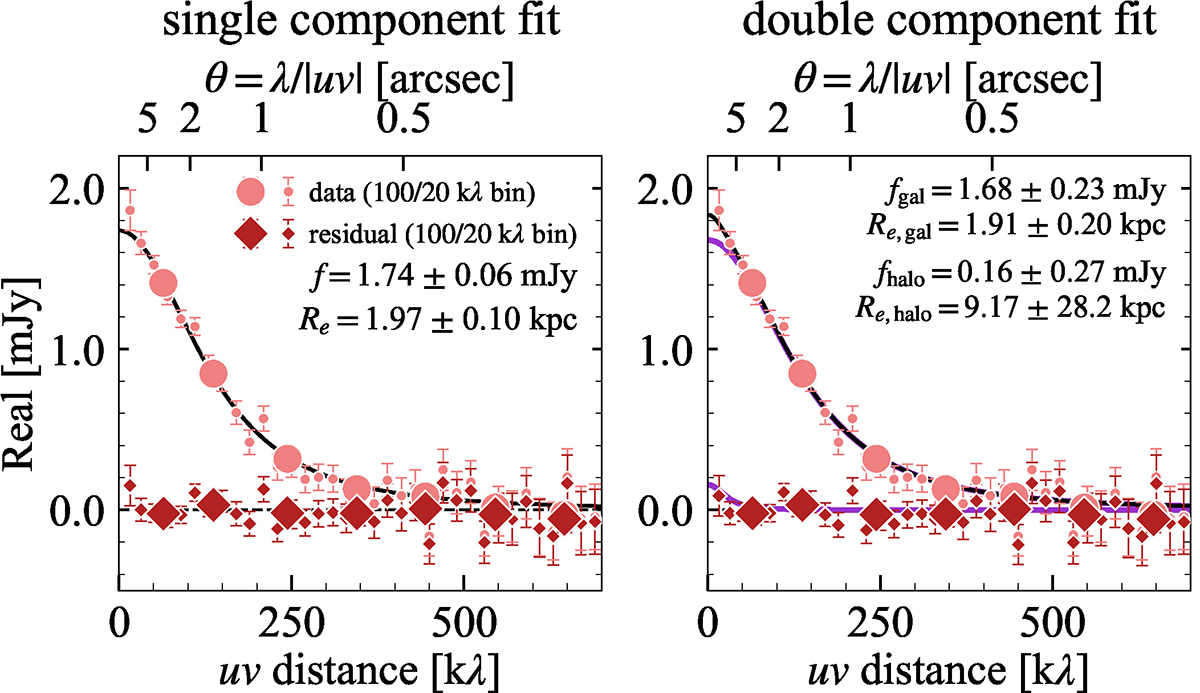
Download original image
Real part of the stacked visibility (circles) and the residual visibility (diamonds) as a function of uv distances for single component (left) and double component (“galaxy” + “halo”; right) fittings. Average values of two types of binning (20 kλ and 100 kλ) are shown. Uncertainties represent a standard deviation of binned visibility data. The best-fit models are shown as a solid black line (total) and solid purple lines (each component). The flux and effective radius of the best-fit models are summarized at the upper right corners. At the smallest 20 kλ bin, the residual show an excess at 1.2σ and 0.7σ significance levels, which corresponds to 8.8% and 5.5% of the total flux density for single and double component fittings, respectively.
Current usage metrics show cumulative count of Article Views (full-text article views including HTML views, PDF and ePub downloads, according to the available data) and Abstracts Views on Vision4Press platform.
Data correspond to usage on the plateform after 2015. The current usage metrics is available 48-96 hours after online publication and is updated daily on week days.
Initial download of the metrics may take a while.