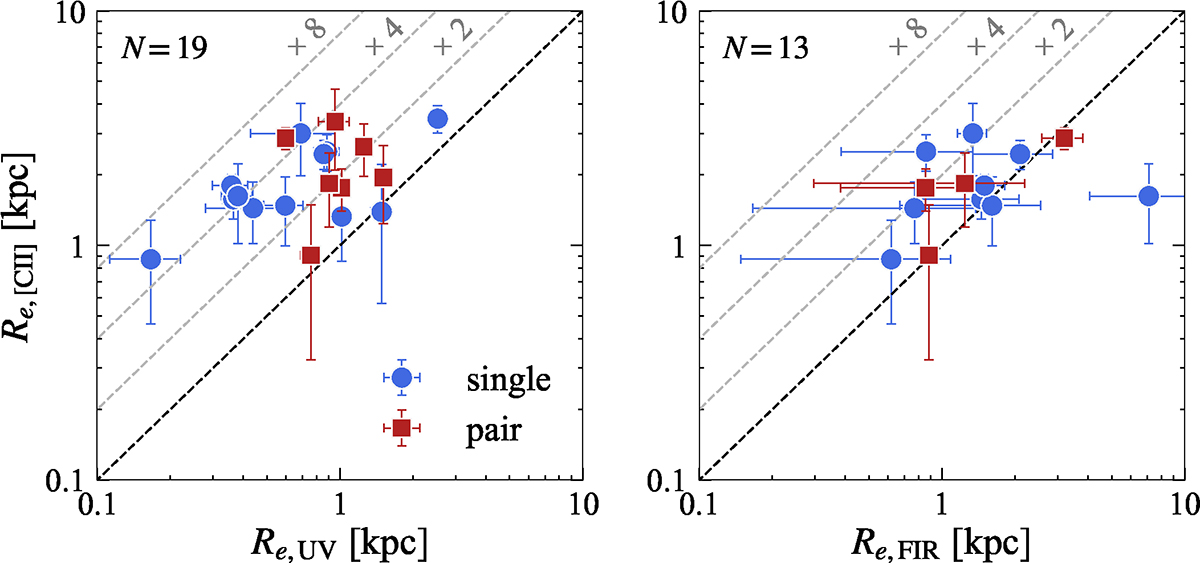
Fig. 5.
Download original image
Comparisons of the effective radii of the [C II] line and the continuum emission. (Left) Effective radius of [C II] line emission compared to the rest-frame UV continuum emission (HST/WFC3 F160W). Symbols are the same as in Figure 4. The dashed black line indicates the one-to-one relation between Re, [CII] and Re, UV, and three dashed gray lines above this line represent Re, [CII]/Re, UV = 2, 4, 8. (Right) Same as the left panel, but [C II] line radius is compared to the rest-frame FIR emission, measured from the ALMA Band-7 continuum images (Mitsuhashi et al. 2024). On average, the [C II] sizes are larger than the rest-frame UV sizes by a factor of 2.90; compared to the rest-frame FIR sizes, they tend to be larger by a factor of 1.54 although with large uncertainties.
Current usage metrics show cumulative count of Article Views (full-text article views including HTML views, PDF and ePub downloads, according to the available data) and Abstracts Views on Vision4Press platform.
Data correspond to usage on the plateform after 2015. The current usage metrics is available 48-96 hours after online publication and is updated daily on week days.
Initial download of the metrics may take a while.