Fig. 4.
Download original image
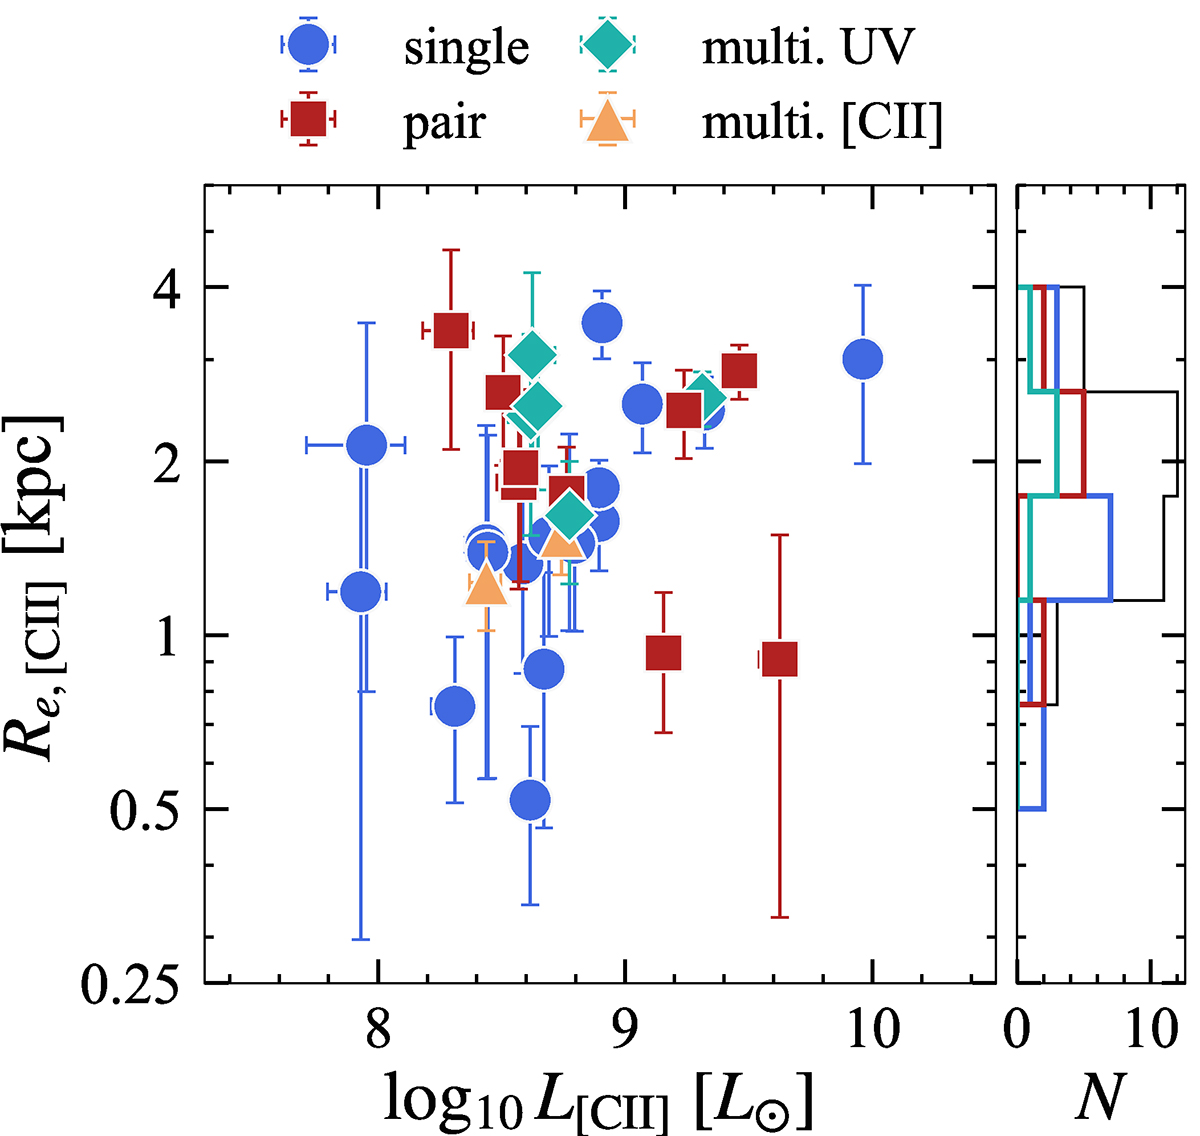
[C II] luminosity-size relation of the CRISTAL sample. Symbols are based on the classification defined in Section 3.1. Each component of the pair/multiple-[C II] systems are shown separately. The right panel shows the histogram of [C II] sizes among categories with matched colors. We omit a histogram of multiple-[C II] because of the small sample size (N = 2). A histogram with a solid black line shows the size distribution of the entire CRISTAL sample. The [C II] sizes show the diversity at fixed [C II] luminosity, in which relatively compact sizes (Re, [CII] ≲ 1 kpc) were challenging to be measured in the previous low-resolution data.
Current usage metrics show cumulative count of Article Views (full-text article views including HTML views, PDF and ePub downloads, according to the available data) and Abstracts Views on Vision4Press platform.
Data correspond to usage on the plateform after 2015. The current usage metrics is available 48-96 hours after online publication and is updated daily on week days.
Initial download of the metrics may take a while.