Fig. 3.
Download original image
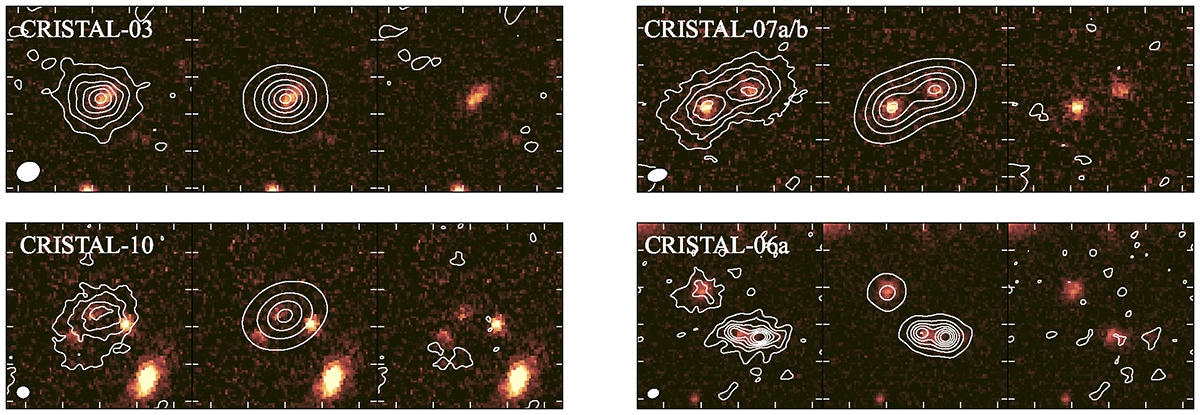
Visualization of the visibility modeling of the [C II] line emission (white contours) in four systems that we showed in Figure 1. The left panel shows the dirty image of a single cube used for the visibility modeling (Section 3.2). The Gaussian FWHM fit from the dirty beam is shown as a white ellipse in the lower-left corner. The middle and right panel show the best-fit exponential disk model and the residual created by subtracting the model from the data, respectively. The contours start at 2σ and increase in steps of 3σ until 20σ. The residual maps do not show any peaks above the 2σ level around the rest-frame UV counterpart, which indicates that the observed emission is characterized by the best-fit model well. The rest of the sample is shown in Figure A.1 and A.2.
Current usage metrics show cumulative count of Article Views (full-text article views including HTML views, PDF and ePub downloads, according to the available data) and Abstracts Views on Vision4Press platform.
Data correspond to usage on the plateform after 2015. The current usage metrics is available 48-96 hours after online publication and is updated daily on week days.
Initial download of the metrics may take a while.