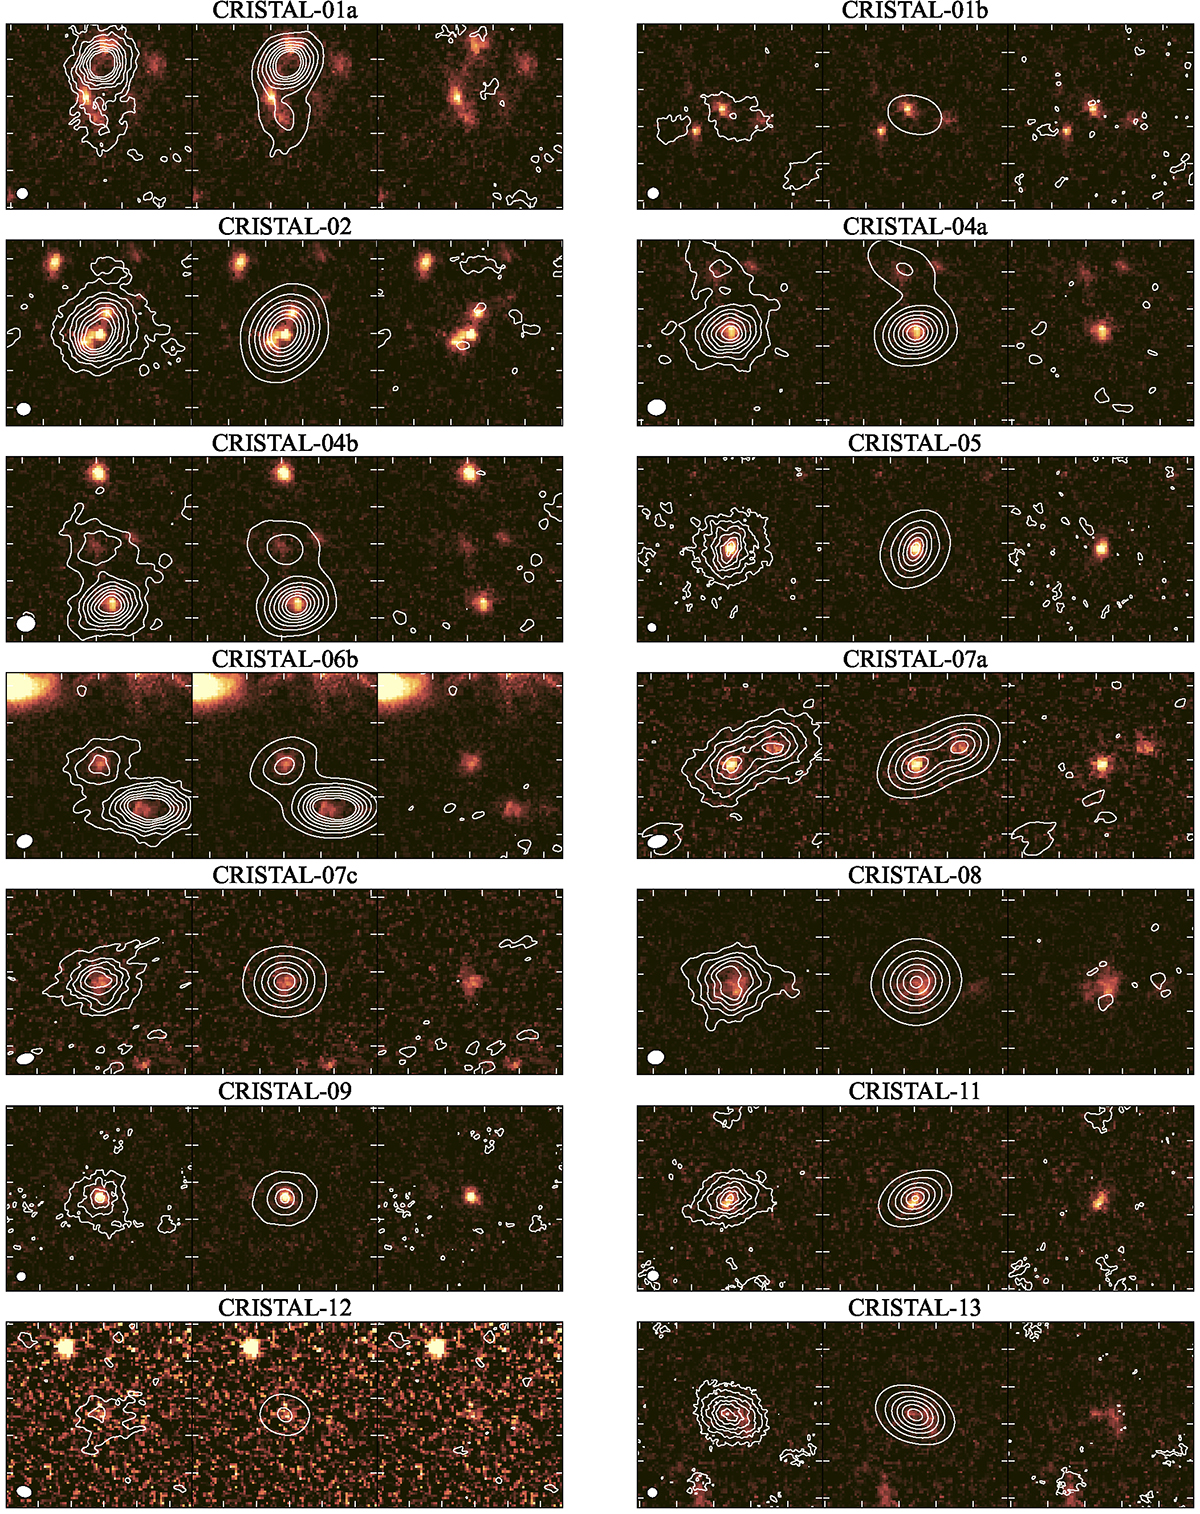
Fig. A.1.
Download original image
Visualization of the visibility modeling of the [C II] line emission in images. The [C II] line contours are overlaid on the HST/WFC3 F160W image. The left panel shows the dirty image of a single cube used for the visibility modeling (Section 3.2). The FWHM of the dirty beam is shown as a white ellipse in the lower-left corner. The middle and right panel show the best-fit model and the residual created by subtracting the model from the data, respectively. A 5″×5″ region is shown. The contours start at 2σ and increase in steps of 3σ until 20σ.
Current usage metrics show cumulative count of Article Views (full-text article views including HTML views, PDF and ePub downloads, according to the available data) and Abstracts Views on Vision4Press platform.
Data correspond to usage on the plateform after 2015. The current usage metrics is available 48-96 hours after online publication and is updated daily on week days.
Initial download of the metrics may take a while.