Fig. 11.
Download original image
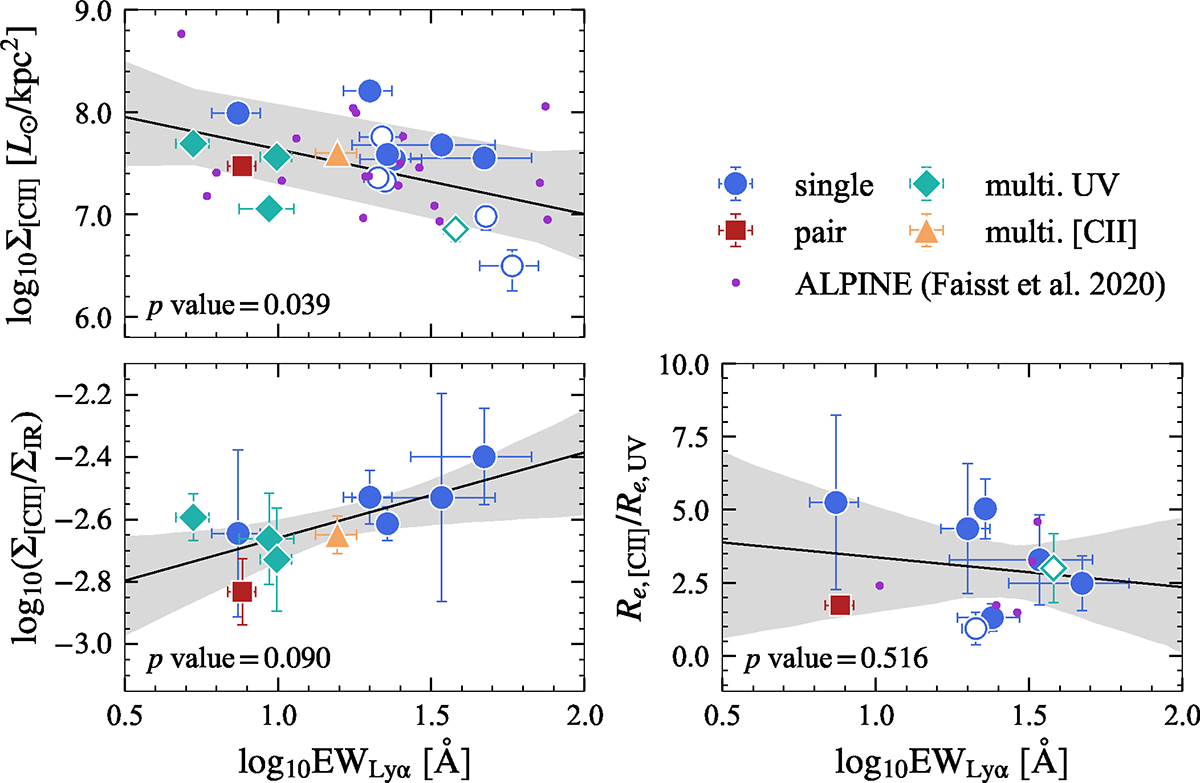
[C II] surface density (top left), [C II]-to-IR surface density ratio (bottom left), and [C II]-to-UV size ratio (bottom right) of the CRISTAL galaxies as a function of the rest-frame EW of Lyα emission. The Lyα properties are taken from Faisst et al. (2020). The galaxies without dust continuum detection are denoted by open symbols. Small purple circles shown in the top left and bottom right panels are the ALPINE galaxies in which [C II] surface density, [C II]-to-UV size ratio (Fujimoto et al. 2020), and Lyα EW (Faisst et al. 2020) are available. We show the linear regression fitting (Table 1) in the solid black line, with the shaded region representing the 95% confidence interval. The p value of a Spearman’s rank correlation test is shown in the lower-left corner of each panel.
Current usage metrics show cumulative count of Article Views (full-text article views including HTML views, PDF and ePub downloads, according to the available data) and Abstracts Views on Vision4Press platform.
Data correspond to usage on the plateform after 2015. The current usage metrics is available 48-96 hours after online publication and is updated daily on week days.
Initial download of the metrics may take a while.