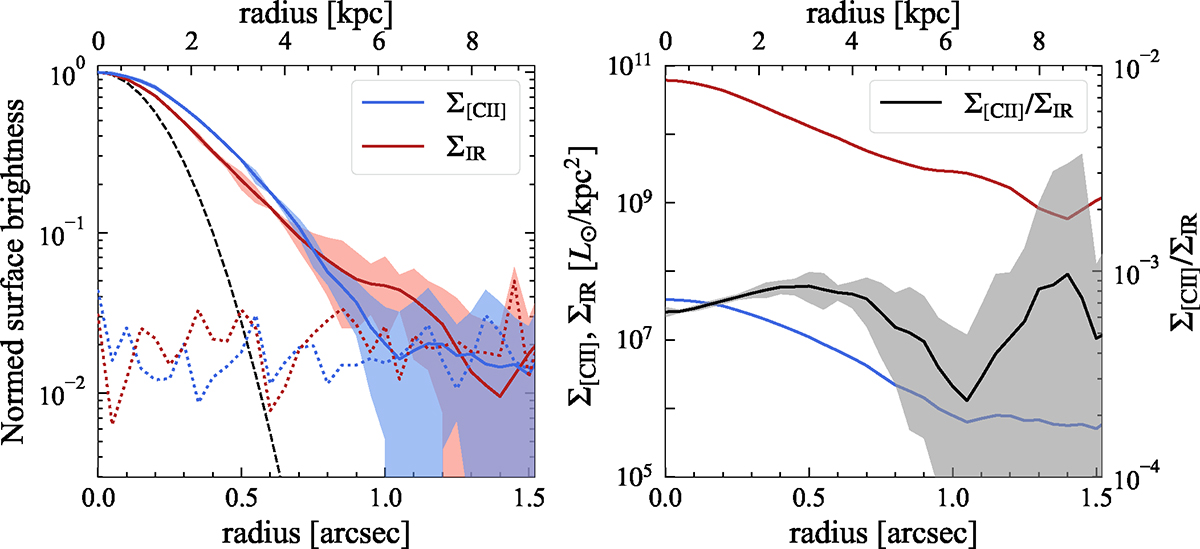
Fig. 10.
Download original image
Radial profiles of the stacked [C II] line and FIR continuum emission. (Left) Normalized radial surface density profile of the uv-stacked image in [C II] line (Re, [CII] = 1.97 ± 0.17 kpc) and FIR continuum (Re, FIR = 1.53 ± 0.22 kpc) emission. The dotted lines show average surface density derived by setting random apertures on blank regions, which are also shown in color-shaded regions as uncertainties. The dashed black curve represents the clean PSF. The top axis is converted to a physical scale assuming an average redshift of z = 5.22 among the stacked sample. (Right) Absolute radial surface density profiles of the [C II] line and FIR continuum emission, in which the unit is converted to L⊙/kpc2. The solid black line shows the ratio between the [C II] line and IR emission (axis shown on the right hand side). As we do not see a strong radial variation in the [C II]-to-IR luminosity ratio, we suggest that the [C II] deficit is not responsible for the extended [C II] line emission.
Current usage metrics show cumulative count of Article Views (full-text article views including HTML views, PDF and ePub downloads, according to the available data) and Abstracts Views on Vision4Press platform.
Data correspond to usage on the plateform after 2015. The current usage metrics is available 48-96 hours after online publication and is updated daily on week days.
Initial download of the metrics may take a while.