Fig. 6
Download original image
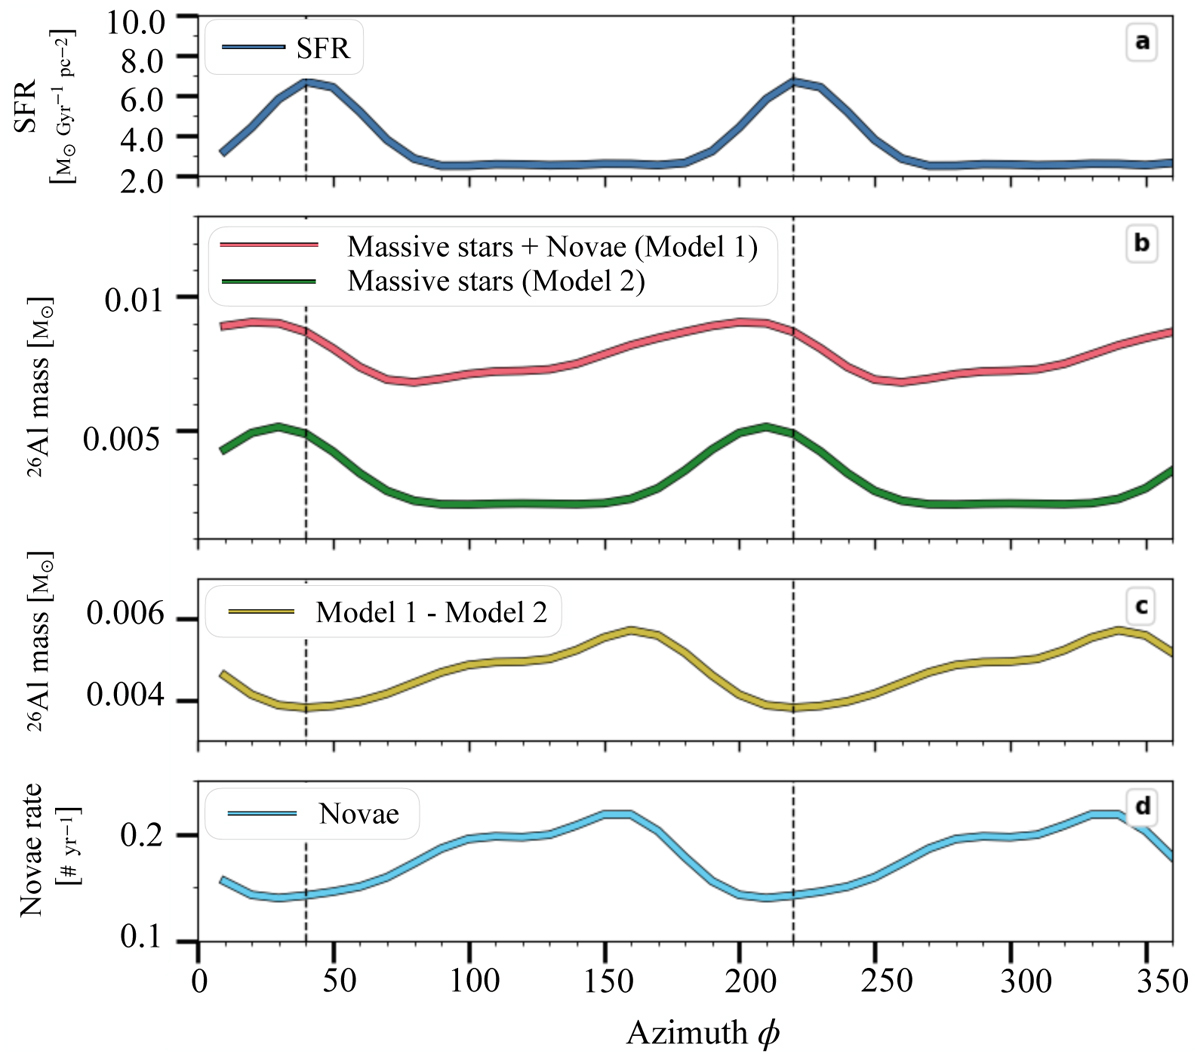
We represent here the azimuthal oscillations of the SFR and the 26Al mass as a function of azimuth. Panel a: SFR as function of azimuth at present time and solar neighbourhood. Here, we represent half of the azimuths since all the quantities are periodic. The black dashed lines, in this plot and in those below, mark the peaks of the SFR. Panel b: 26Al distribution in solar ring and present time. In pink, we show 26Al predicted by Model 1, and in green we show that from Model 2. Panel c: difference between 26Al production in the two cases. Panel d: Novae distribution in solar ring at present time.
Current usage metrics show cumulative count of Article Views (full-text article views including HTML views, PDF and ePub downloads, according to the available data) and Abstracts Views on Vision4Press platform.
Data correspond to usage on the plateform after 2015. The current usage metrics is available 48-96 hours after online publication and is updated daily on week days.
Initial download of the metrics may take a while.