Open Access
Fig. 4
Download original image
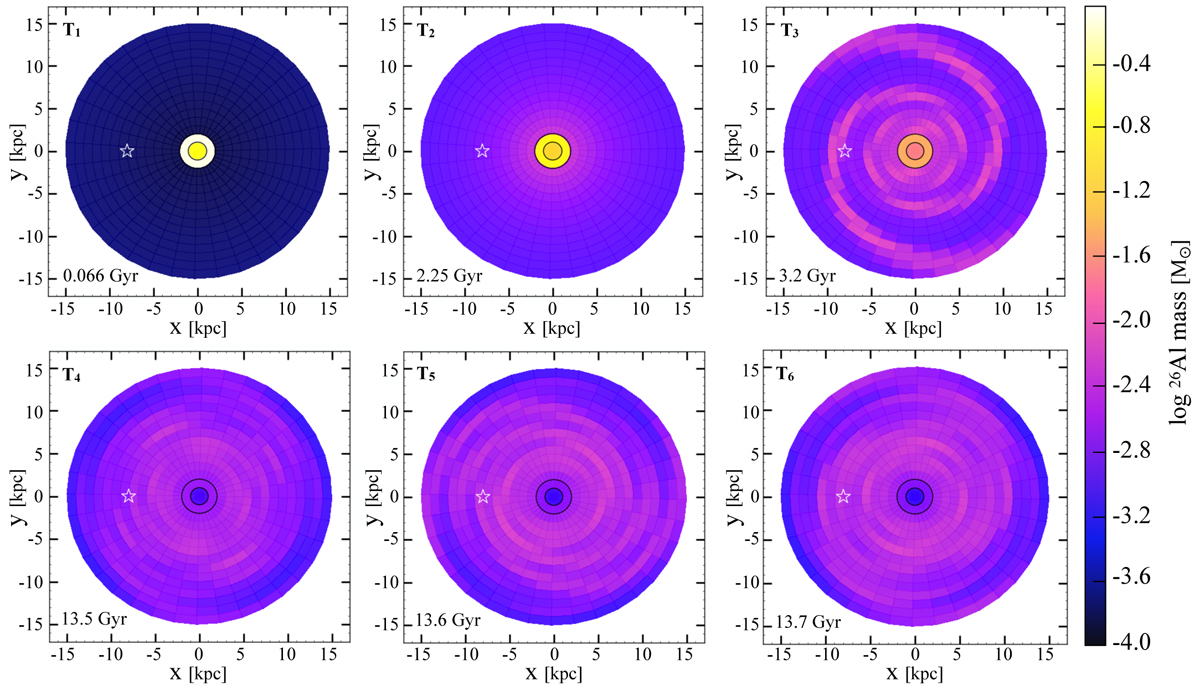
Two-dimensional distribution of 26Al mass at the six time steps where we have previously analysed the SFR. In this case, we counted both massive stars and novae as 26Al producers. Each cell is colour-coded according to the 26Al mass contained at that time step, and as in Fig. 2 the sun is indicated by the white-edge star.
Current usage metrics show cumulative count of Article Views (full-text article views including HTML views, PDF and ePub downloads, according to the available data) and Abstracts Views on Vision4Press platform.
Data correspond to usage on the plateform after 2015. The current usage metrics is available 48-96 hours after online publication and is updated daily on week days.
Initial download of the metrics may take a while.