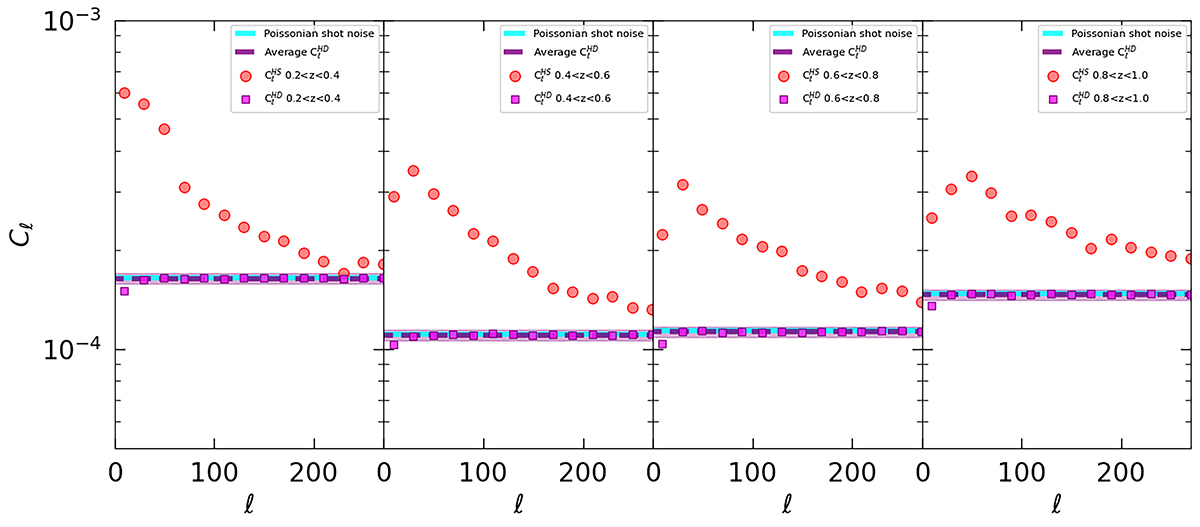
Fig. 8.
Download original image
Shot noise estimation over 100 realisations, using one realisation of the PINOCCHIO PLCs, in four redshift bins in the range 0.2 < z < 1.0 (panels from left to right). The red circles represent the angular power spectrum of the half-sum (HS) maps, which include the contribution of both signal and noise. The purple squares instead show the angular power spectrum of the half-difference (HD) maps, which provide a direct estimate of the shot noise, with their average (purple dashed line) and standard deviation (purple shaded band) in agreement with the theoretical Poissonian value (cyan solid line).
Current usage metrics show cumulative count of Article Views (full-text article views including HTML views, PDF and ePub downloads, according to the available data) and Abstracts Views on Vision4Press platform.
Data correspond to usage on the plateform after 2015. The current usage metrics is available 48-96 hours after online publication and is updated daily on week days.
Initial download of the metrics may take a while.