Fig. C.1.
Download original image
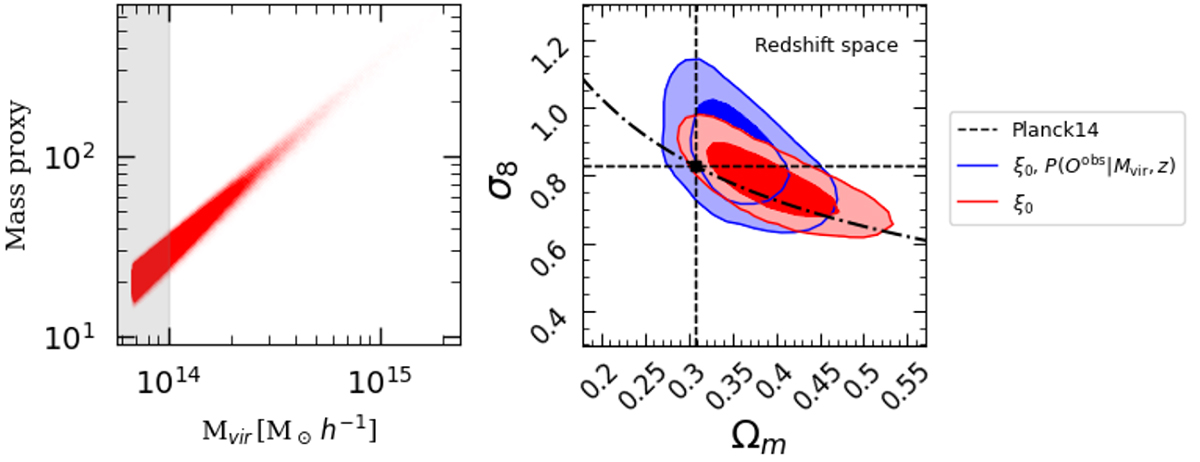
Mass proxy in cosmological analysis. Left panel: Mass-observable distribution of galaxy clusters in our mock catalogue. The grey shaded region represents the mass selection of our sample, excluding clusters with Mvir < 1014 M⊙ h−1. Right panel: Marginalised posterior distributions in the Ωm − σ8 plane, with 68% and 95% confidence intervals, using a binwidth of Δz = 0.4, in redshift space. The red contour shows the result for the two-point correlation function monopole, while the blue contour accounts also for the effect of the mass-observable scaling relation. The dashed lines indicate the Ωm and σ8 values of the PINOCCHIO simulation, while the dot-dashed line shows the predicted S8 degeneracy curve.
Current usage metrics show cumulative count of Article Views (full-text article views including HTML views, PDF and ePub downloads, according to the available data) and Abstracts Views on Vision4Press platform.
Data correspond to usage on the plateform after 2015. The current usage metrics is available 48-96 hours after online publication and is updated daily on week days.
Initial download of the metrics may take a while.