Fig. 2.
Download original image
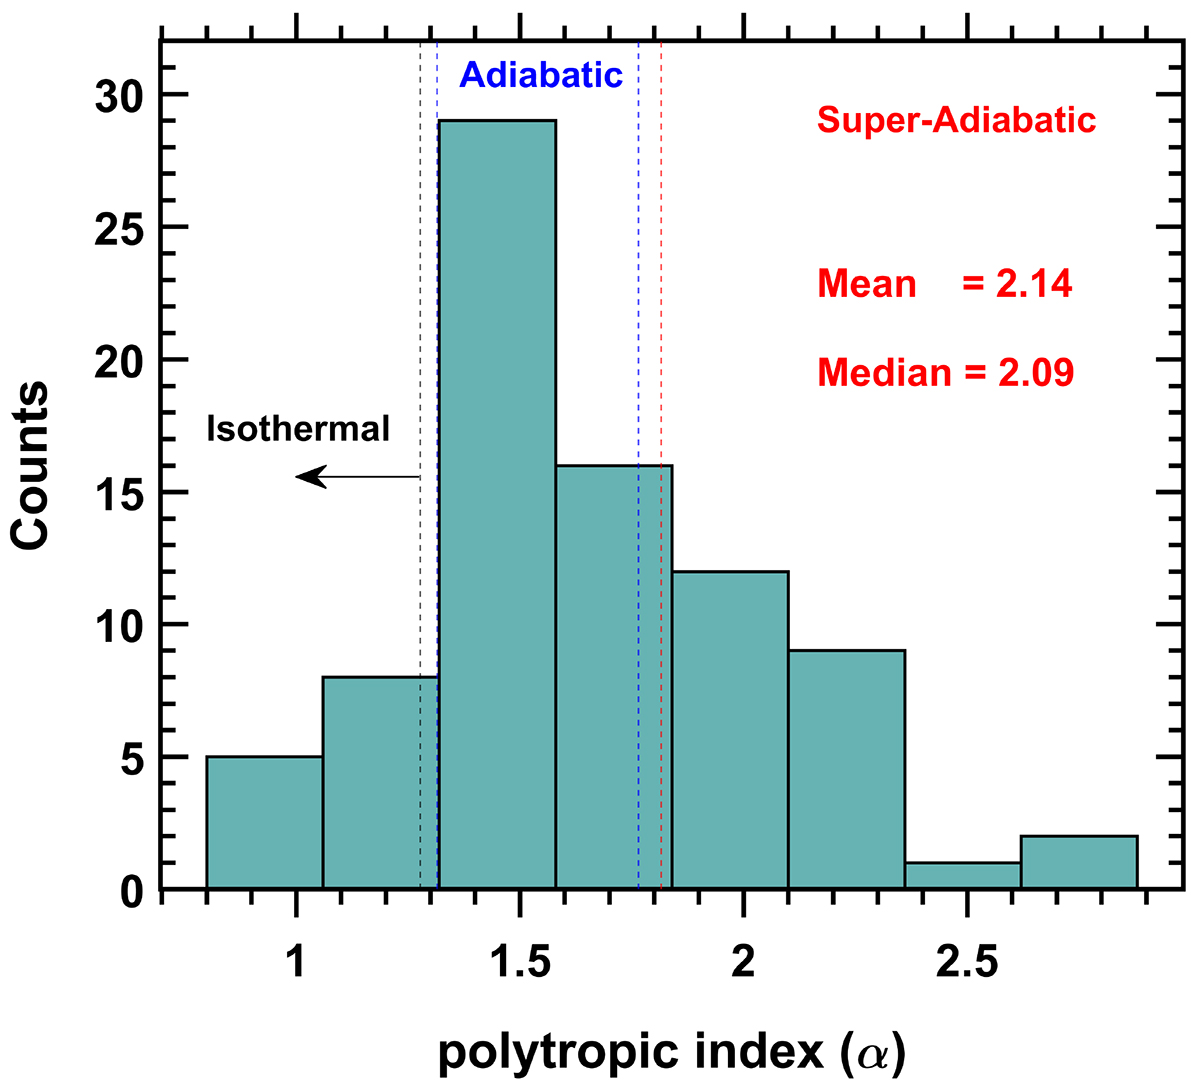
Distribution of the polytropic index (α) for 82 ICME MOs. The data points to the left of the vertical dashed black line correspond to 12 isothermal MOs. The region between the vertical dashed blue line comprises 45 adiabatic MOs. Data points to the right of the vertical dashed red lines are the ICME MOs with super-adiabatic behaviour listed in Table B.1. The mean and median values are only for these 25 super-adiabatic ICME MOs.
Current usage metrics show cumulative count of Article Views (full-text article views including HTML views, PDF and ePub downloads, according to the available data) and Abstracts Views on Vision4Press platform.
Data correspond to usage on the plateform after 2015. The current usage metrics is available 48-96 hours after online publication and is updated daily on week days.
Initial download of the metrics may take a while.