Fig. 2
Download original image
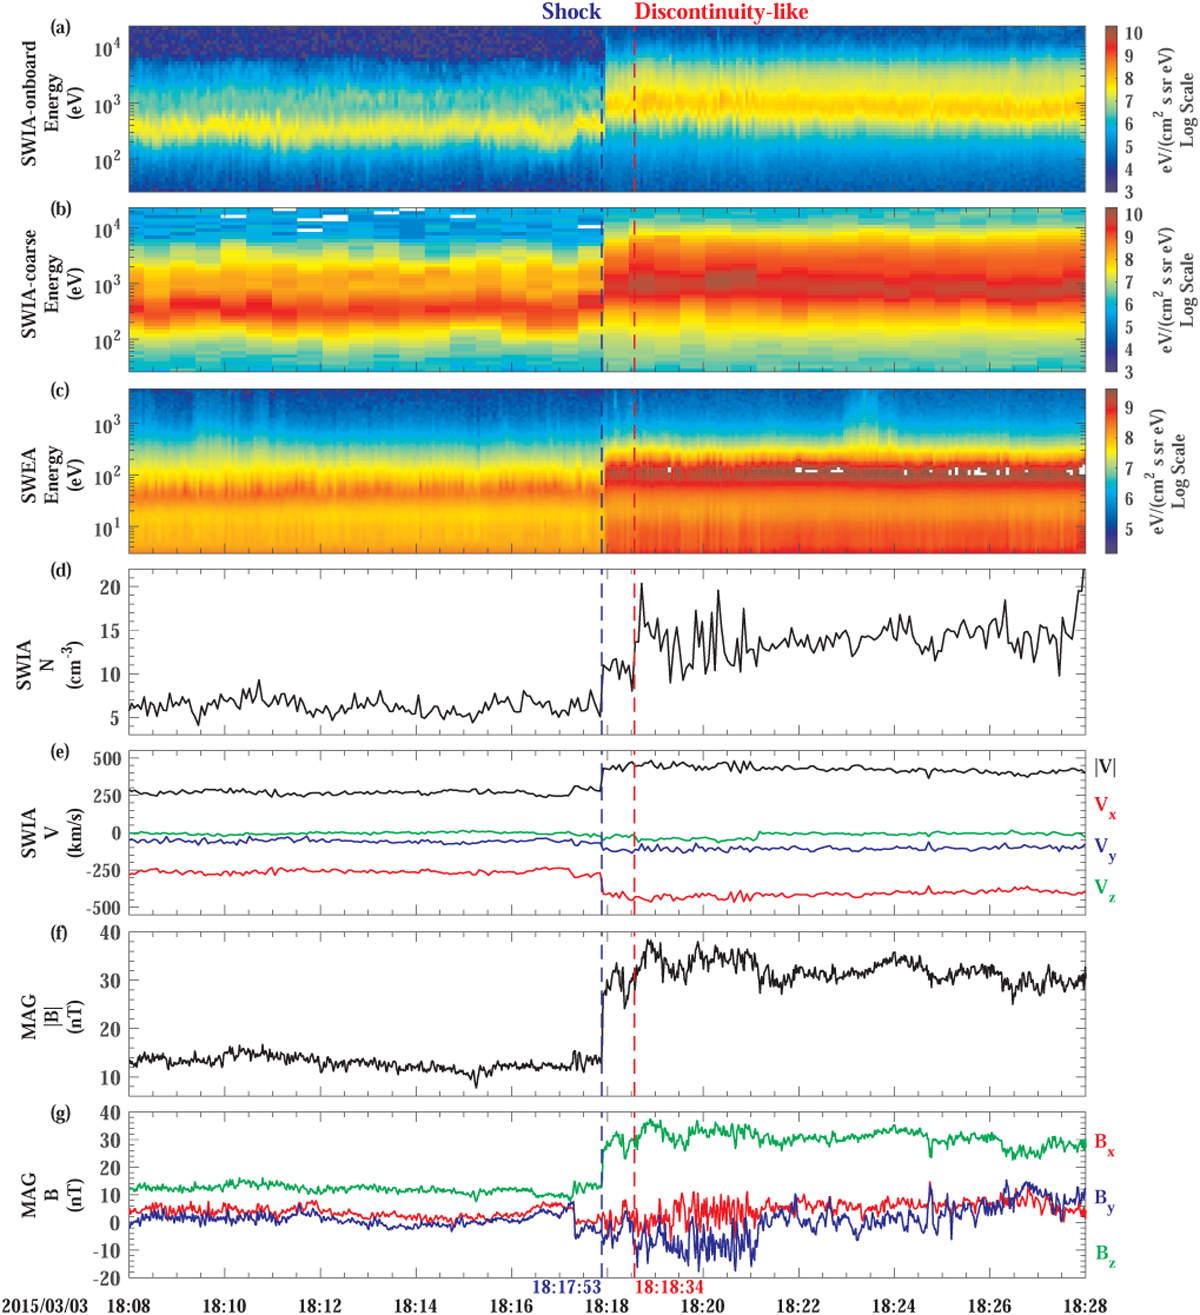
Overview plots of the transmitted shock and discontinuity-like structure encountered by MAVEN. (a) On-board-computed ion energy spectra. (b) Ion energy spectra computed on the ground from the Coarse 3D data. (c) Electron energy spectra. (d) Proton density. (e) Proton velocity components in MSO coordinates and proton bulk speed. (f) Magnetic field magnitude. (g) Magnetic field components in MSO coordinates. The vertical dashed blue and red lines correspond to the transmitted IP shock and discontinuity-like structure, respectively.
Current usage metrics show cumulative count of Article Views (full-text article views including HTML views, PDF and ePub downloads, according to the available data) and Abstracts Views on Vision4Press platform.
Data correspond to usage on the plateform after 2015. The current usage metrics is available 48-96 hours after online publication and is updated daily on week days.
Initial download of the metrics may take a while.