Fig. 1
Download original image
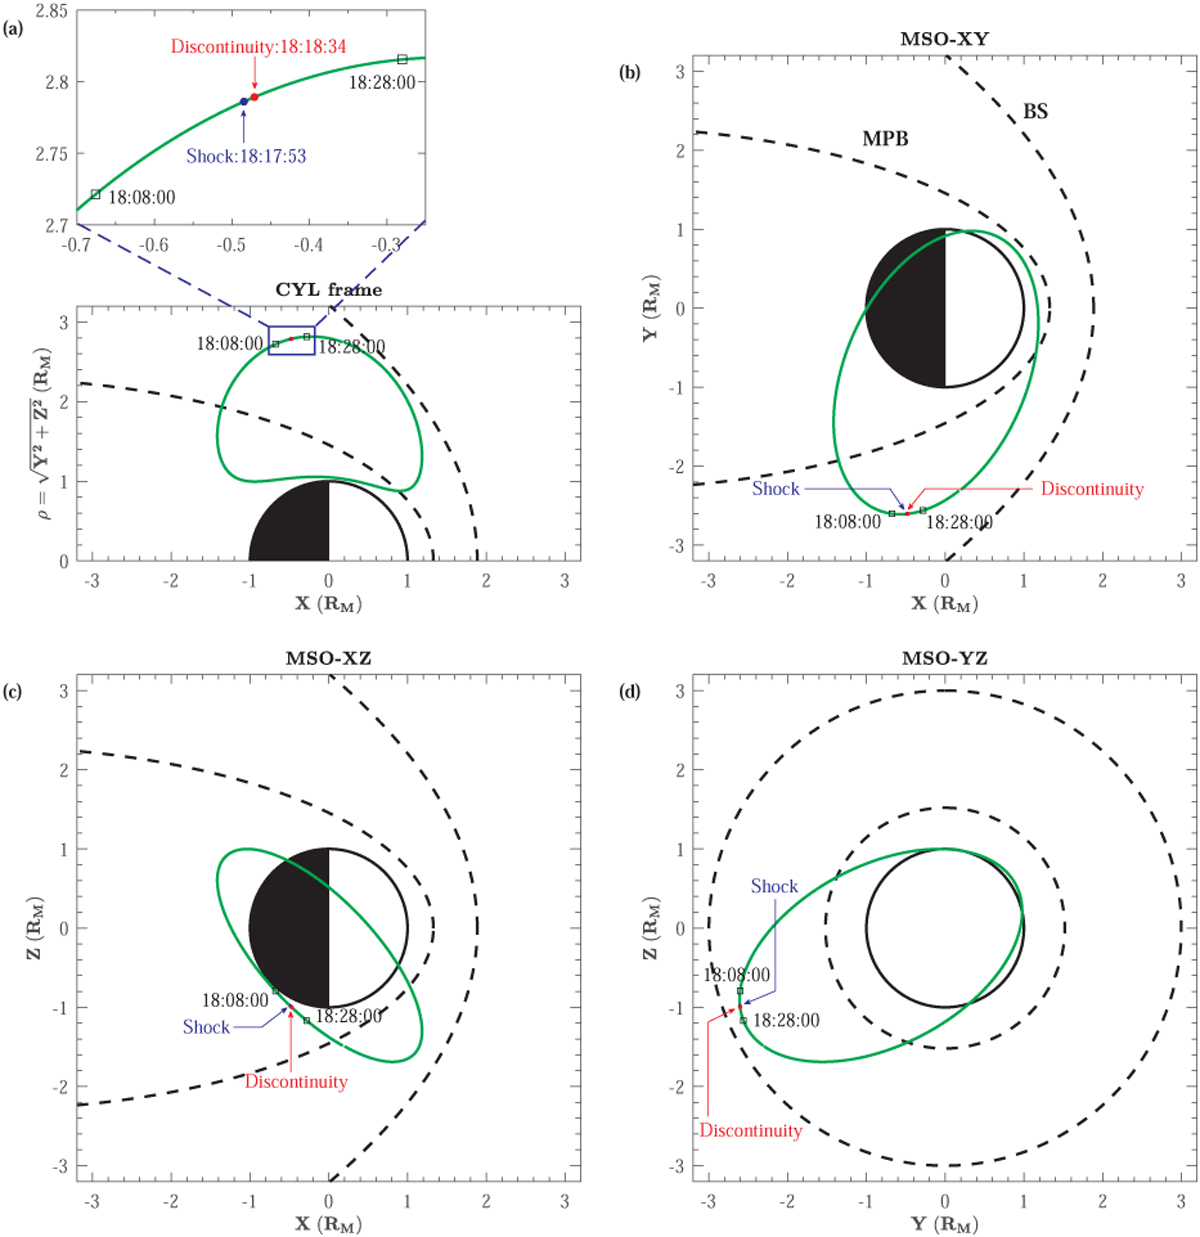
MAVEN orbit information. (a) MAVEN trajectory (green line) for the time interval of orbit 822, on March 3, 2015, shown in cylindrical (CYL) MSO coordinates frame. The blue and red arrows mark the positions of MAVEN at the arrival times of the transmitted IP shock and discontinuity-like structure, respectively, (b–d) the same trajectory on the MSO XY, XZ, and YZ planes. The two dashed black curves in each panel represent the average locations of the BS and magnetic pileup boundary.
Current usage metrics show cumulative count of Article Views (full-text article views including HTML views, PDF and ePub downloads, according to the available data) and Abstracts Views on Vision4Press platform.
Data correspond to usage on the plateform after 2015. The current usage metrics is available 48-96 hours after online publication and is updated daily on week days.
Initial download of the metrics may take a while.