Fig. 8
Download original image
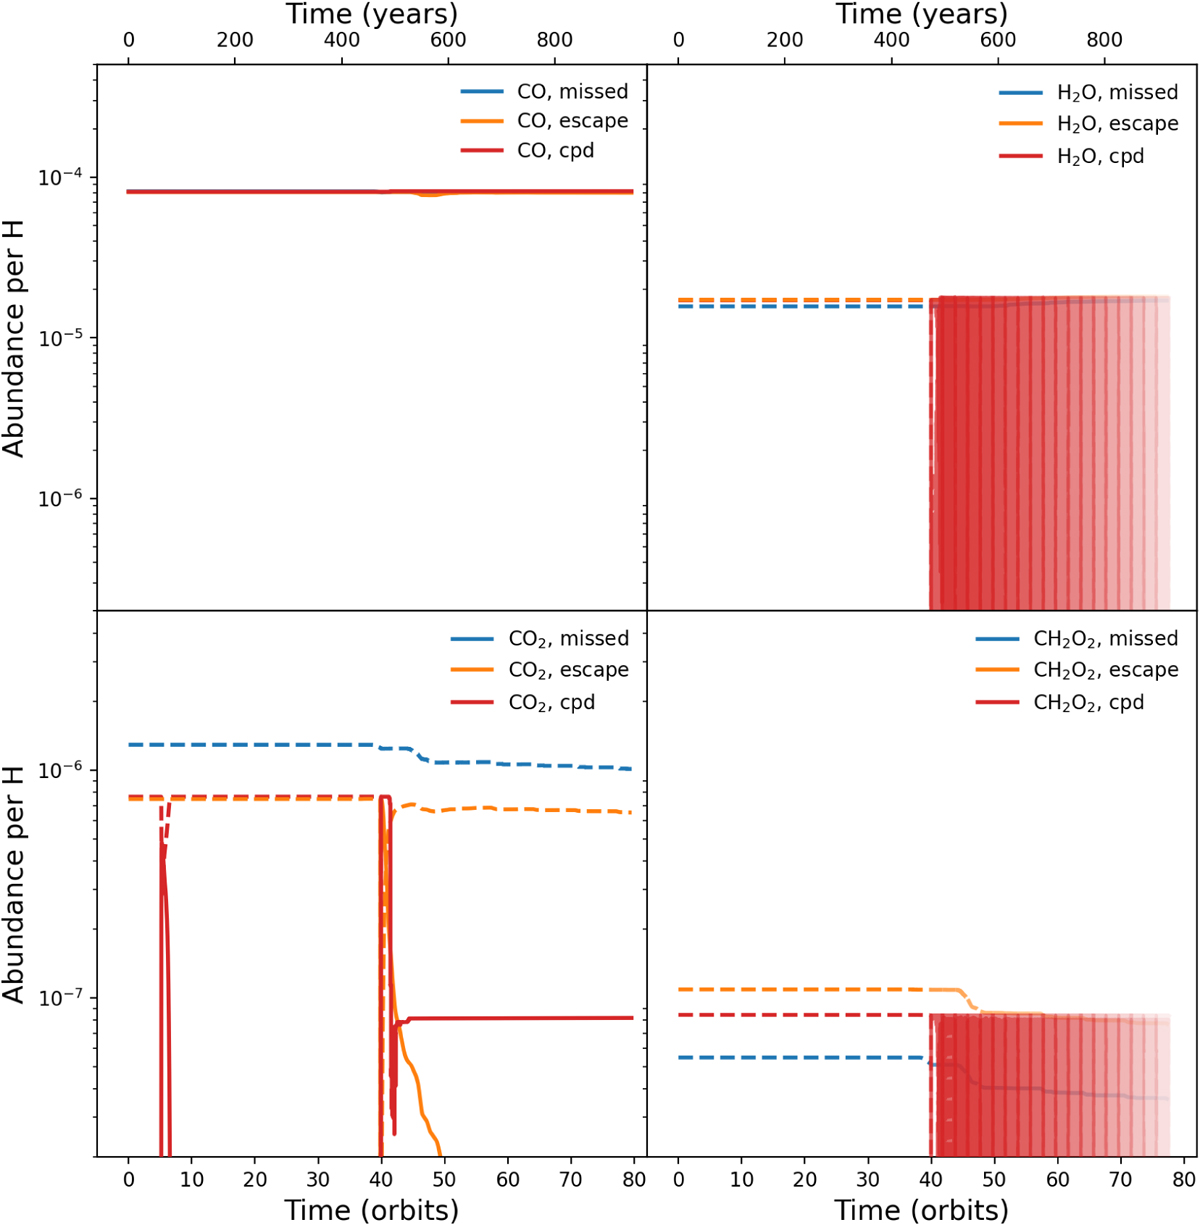
Evolution of the most abundant oxygen-bearing species for the three test streamlines. The solid lines represent the gas phase of each species, while the dashed lines represent the ice species. CH2O2 represents the most abundant organic species in the CPD. We note the change in y-axis range between the top and bottom rows. For water and CH2O2 the opacity of the line for t > 40 orbits is slowly reduced to better see the other lines on the plot.
Current usage metrics show cumulative count of Article Views (full-text article views including HTML views, PDF and ePub downloads, according to the available data) and Abstracts Views on Vision4Press platform.
Data correspond to usage on the plateform after 2015. The current usage metrics is available 48-96 hours after online publication and is updated daily on week days.
Initial download of the metrics may take a while.