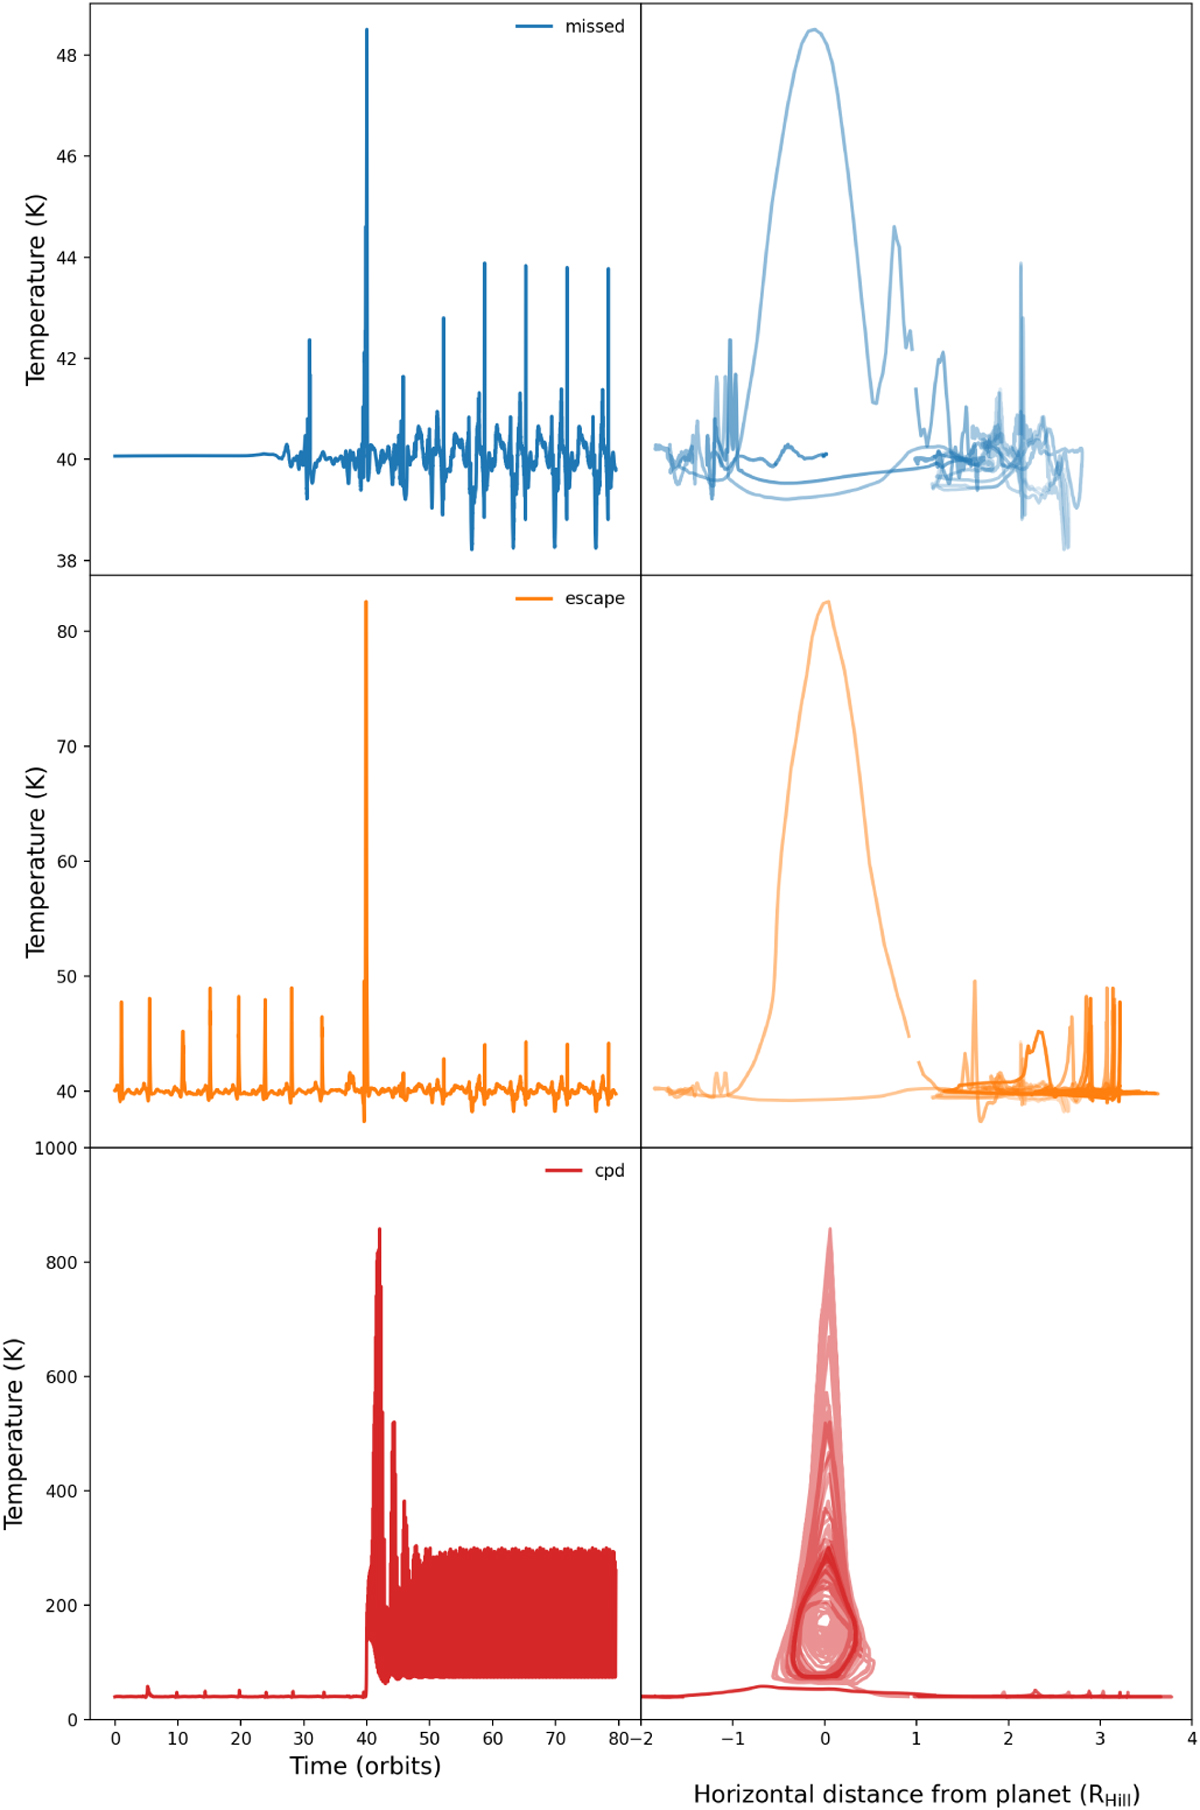
Fig. 7
Download original image
Temperature evolution for test streamlines. The first column shows the temperature as a function of time in orbits of the embedded planet. The second column shows the same temperature evolution of the streamlines as a function of distance from the planet. The streamlines that enter the CPD first do so at around the same time (~40 orbits) because their forward integration is started just before they enter the CPD. In the second row the opacity of the line for t > 40 orbits is reduced as a function of time to better differentiate separate orbits in the CPD.
Current usage metrics show cumulative count of Article Views (full-text article views including HTML views, PDF and ePub downloads, according to the available data) and Abstracts Views on Vision4Press platform.
Data correspond to usage on the plateform after 2015. The current usage metrics is available 48-96 hours after online publication and is updated daily on week days.
Initial download of the metrics may take a while.