Fig. 4
Download original image
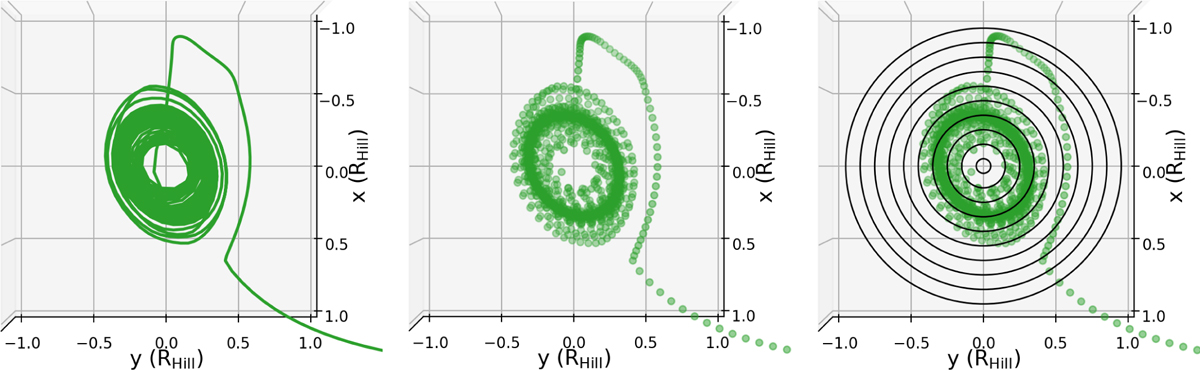
Visualisation of the griding for the column number density calculation, viewed along the z-axis. The left panel shows a zoomed-in image of a streamline that enters into the CPD and remains for the bulk of the integration. The axes show distance relative to the location of the planet, in a rotating reference frame. The middle panel is the same as the left panel, but shows the points along the streamline computed during the integration. The right panel shows each individual point computed along the streamline as well as circles on which we compute the average volume number density of a given molecule at a given r and z in cylindrical coordinates.
Current usage metrics show cumulative count of Article Views (full-text article views including HTML views, PDF and ePub downloads, according to the available data) and Abstracts Views on Vision4Press platform.
Data correspond to usage on the plateform after 2015. The current usage metrics is available 48-96 hours after online publication and is updated daily on week days.
Initial download of the metrics may take a while.