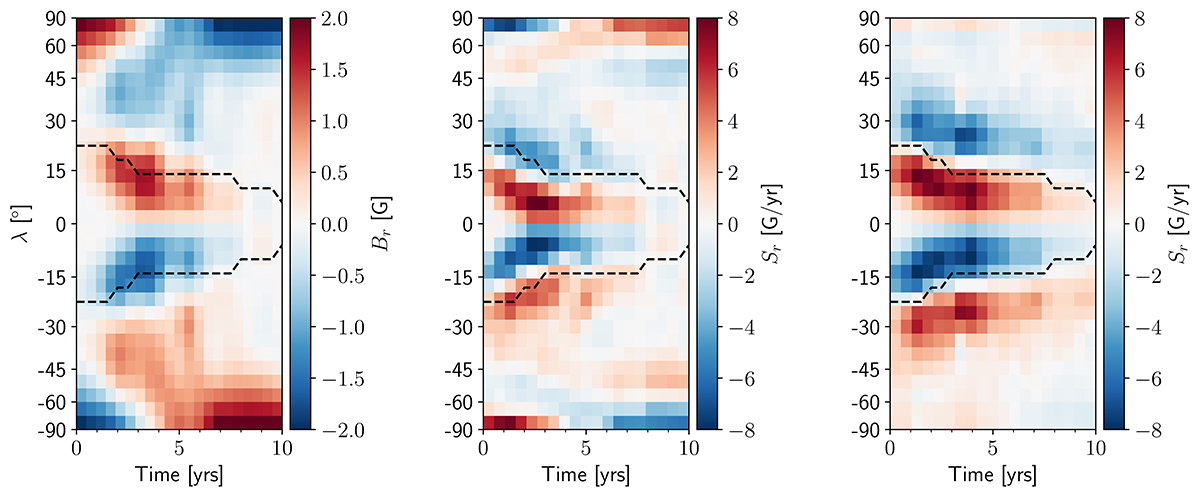
Fig. 2.
Download original image
Mean observed butterfly diagram and poloidal field generation rate. Left panel: Cycle-averaged butterfly diagram from Paper II. Middle panel: Surface radial source term obtained from the left panel by ‘inverting’ a 1D SFT model. Right panel: Surface radial source term obtained from the surface toroidal field (not shown) using an emergence model. See Paper II for more information. The dashed lines represent the location of the maximum surface toroidal field.
Current usage metrics show cumulative count of Article Views (full-text article views including HTML views, PDF and ePub downloads, according to the available data) and Abstracts Views on Vision4Press platform.
Data correspond to usage on the plateform after 2015. The current usage metrics is available 48-96 hours after online publication and is updated daily on week days.
Initial download of the metrics may take a while.