Fig. 1.
Download original image
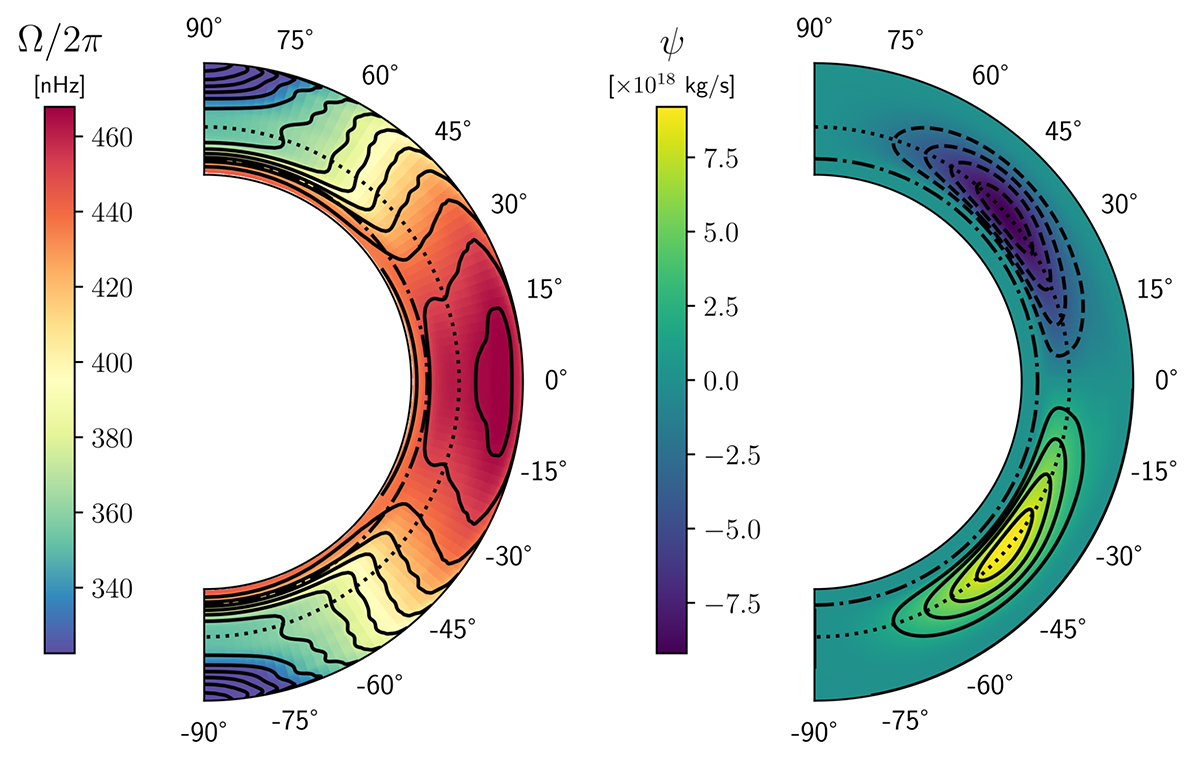
The rotation profile of Larson & Schou (2018) obtained from HMI data (left) and the cycle-averaged and symmetrized stream function of the helioseismic meridional flow inversions of Gizon et al. (2020, right). For the latter, positive values represent clockwise circulation and negative anticlockwise. The dash-dotted and dotted lines represent the approximate locations of the tachocline at 0.7 R⊙ and the reversal of the meridional flow direction at 0.8 R⊙, respectively.
Current usage metrics show cumulative count of Article Views (full-text article views including HTML views, PDF and ePub downloads, according to the available data) and Abstracts Views on Vision4Press platform.
Data correspond to usage on the plateform after 2015. The current usage metrics is available 48-96 hours after online publication and is updated daily on week days.
Initial download of the metrics may take a while.