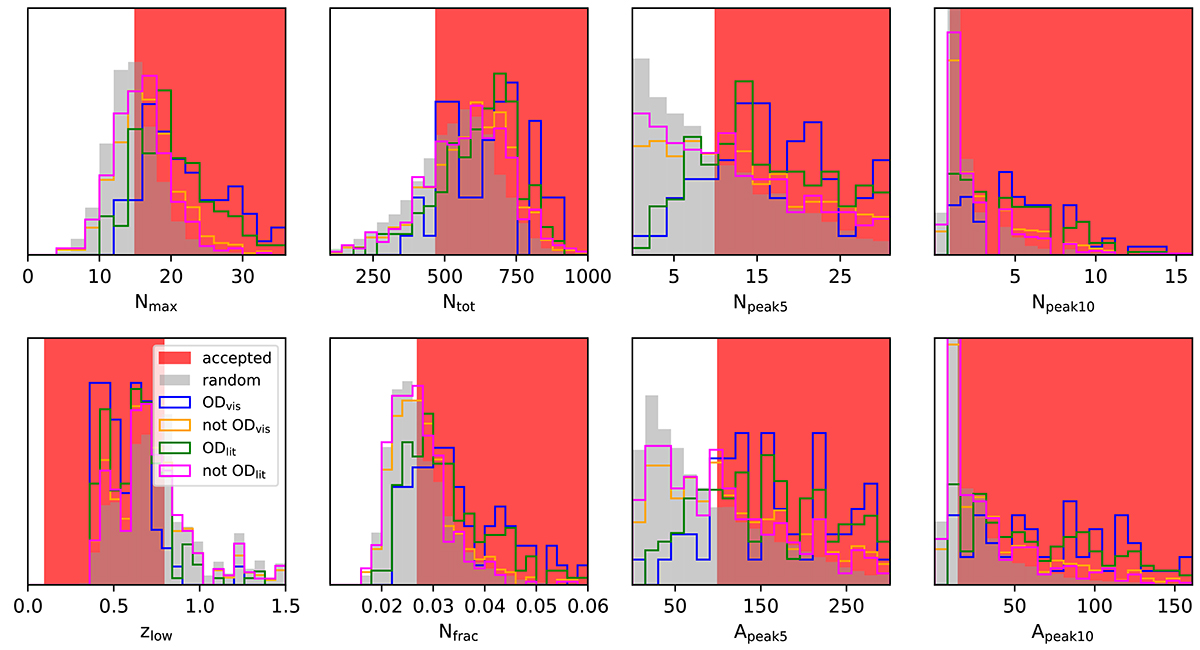
Fig. 5.
Download original image
Normalized histograms of our eight introduced selection criteria. We distinguish between lens candidates visually identified to be in an overdensity (blue) or through the galaxy cluster catalogs (green), compared to those not in an overdensity (orange and magenta, respectively). We further show, for comparison, the distribution from 10 000 random positions in gray. Following the F1 criterion, we highlight the parameter range indicating overdensities in red (shaded regions for criteria No. 46 in Table B.1), which demonstrates that a combination of these different criteria is crucial to gain good performance.
Current usage metrics show cumulative count of Article Views (full-text article views including HTML views, PDF and ePub downloads, according to the available data) and Abstracts Views on Vision4Press platform.
Data correspond to usage on the plateform after 2015. The current usage metrics is available 48-96 hours after online publication and is updated daily on week days.
Initial download of the metrics may take a while.